


International Development
ISSN 1470-2320
Prizewinning Dissertation 2022
No.22-LG
State Versus Market: The Case of Tobacco
Consumption in Eastern European and Former
Soviet Transition Economies
Letizia Gazzaniga
Published: Jan 2023
Department of International Development
London School of Economics and Political Science
Houghton Street Tel: +44 (020) 7955 7425/6252
London Fax: +44 (020) 7955-6844
WC2A 2AE UK Email: d.daley@lse.ac.uk
Website: http://www.lse.ac.uk/internationalDevelopment/home.aspx
DV410 31699
Abstract
Eastern European and former Soviet Union countries transitioned from command to market economy after the Cold War. The market was blamed for poor health consequences and increasing tobacco consumption throughout this shift. This study enters the state vs market debate by focusing on the state’s function. A regression with fixed effects is run to study the correlation between foreign direct investments, as a proxy for the market, and state quality, as a proxy for the state, on tobacco consumption, as a component of development. Findings suggest that the state, not the market, may have influenced tobacco use and, consequently, development.
Acronyms
BAT British American Tobacco
CIS Commonwealth of Independent States
CMEA Council for Mutual Economic Cooperation
EU-8 Eight countries of Central and Eastern Europe
EEFSC Eastern European and Former Soviet Countries
EU European Union
FDI Foreign Direct Investments
GDP Gross Domestic Product
HDI Human Development Index
IMF International Monetary Fund
SDG Sustainable Development Goal
SEE South-eastern Europe
TC Tobacco Consumption
TTC Transnational Tobacco Companies
WB World Bank
WTO World Trade Organization
DV410 31699
Table of Contents
1. Introduction ……………………………………………………………………………………………………………………………….
2.Literature Review ………………………………………………………………………………………………………………………..
2.1 Transition to Market Economies ……………………………………………………………………………………………….
2.2 FDI ………………………………………………………………………………………………………………………………………
2.3 Tobacco Companies Investments …………………………………………………………………………………………….
2.4 The Role of the State ……………………………………………………………………………………………………………..
2.4.1 Lobbying ………………………………………………………………………………………………………………………..
2.4.2 Corruption and Criminality ………………………………………………………………………………………………
2.4.3 Weak Legislative power …………………………………………………………………………………………………..
2.4.4 Weak Executive power …………………………………………………………………………………………………….
2.4.5 Welfare ………………………………………………………………………………………………………………………….
2.5 Outcomes of the Transition …………………………………………………………………………………………………….
2.5.1 Health Outcomes …………………………………………………………………………………………………………….
2.5.2 Determinants of the Outcomes According to the Literature …………………………………………………..
3.Theoretical Framework ……………………………………………………………………………………………………………..
4.Research Aims …………………………………………………………………………………………………………………………..
5. Data and Methodology ………………………………………………………………………………………………………………
5.1Data ……………………………………………………………………………………………………………………………………..
5.2 Data Reliability ……………………………………………………………………………………………………………………..
5.3 Dataset …………………………………………………………………………………………………………………………………
5.4 Empirical Model ……………………………………………………………………………………………………………………
6. Results ………………………………………………………………………………………………………………………………………
6.1 Preliminary Evidence …………………………………………………………………………………………………………….
6.1.1 Descriptive Statistics ……………………………………………………………………………………………………….
6.1.2 Correlation ……………………………………………………………………………………………………………………..
6.1.3 Robustness Check ……………………………………………………………………………………………………………
6.2 Trends and Subgroups Characteristics ……………………………………………………………………………………..
6.2.1 TC …………………………………………………………………………………………………………………………………
6.2.2 FDI ………………………………………………………………………………………………………………………………..
6.2.3 State ………………………………………………………………………………………………………………………………
6.3 Regression analysis ……………………………………………………………………………………………………………….
6.3.1 The Impact of FDI on TC …………………………………………………………………………………………………
6.3.2 The Impact of state on TC ………………………………………………………………………………………………..
6.3.3 The impact of Macroeconomic Variables on TC………………………………………………………………….
7.Policy Implications …………………………………………………………………………………………………………………….
DV410 31699
8.Limitations ………………………………………………………………………………………………………………………………..
9.Future Research …………………………………………………………………………………………………………………………
10.Conclusions ……………………………………………………………………………………………………………………………..
11.Bibliography …………………………………………………………………………………………………………………………….
DV410 31699
1. Introduction
Since the fall of the Berlin wall in 1989 and the following collapse of the Soviet Union in 1991, great changes have taken place in Eastern European and Former Soviet Countries (EEFSC) (Tondel, 2001). Czechoslovakia and the Soviet Union disintegrated into separate countries (Tondel, 2001) and the investment bloc disintegrated (Brodman, 2005). As a result, the EEFSC’s primary central planning instrument, the Council for Mutual Economic Cooperation (CMEA), was abolished because it no longer served (Brodman, 2005). The end of CMEA has more than just symbolic meaning. It meant that, in reality, the EEFSC’s international trade was no longer governed by administrative tasks but instead, the transactions became conditioned by market forces (Brodman, 2005).
This occurred after the bloc had halted international trade for 70 years, and it in many ways exemplified the rapid rise in global economic integration that had been occurring worldwide (Brodman, 2005). It is from this moment that the communist EEFSC became “transition economies”, defined as countries “in the process of change from a centrally planned (socialist) economy to a market economy” (Gurkov, 2015).
During the transition, the market and the state were both forces able to shape development outcomes, the market mainly through foreign direct investments (FDI) while the state through its ability to implement policies. Hence, this scenario of transition offers a very peculiar and interesting case to participate in the state versus market debate, by understanding which of the two forces was influencing development outcomes.
Since according to Sen (2001) health is considered a component of development, this paper narrows the research to it, and specifically to one of its main hazardous behaviours, tobacco consumption (TC). This focus on health would extend the debate beyond the economic sphere, putting it into the current path that development is taking. Investigating TC specifically provides useful knowledge on a phenomenon that in the EEFSC spread and became a serious health concern. Additionally, smoking habits are closely related to an industry that has adopted very aggressive economic strategies to reach the developing world’s market economies, meaning that TC is connected to both the market and the state.
As a result, this research wishes to answer the following question: to what extent the market or
the state have influenced TC during the transition in EEFSC? The state influences have received little attention in the current literature on health and TC in transition countries, which has mostly concentrated on the market. Filling this gap is relevant to understanding how the two forces impact development. Additionally, bridging the gap might produce insights that help transitioning nations by providing policy advice on how to embrace change and the importance to attribute to institutions during the process.
DV410 31699
To fill this gap, the study conducts a literature review on the market and state factors at play in the EEFSC in order to build a narrative and provide context for the selection of the variables. The next step is to conduct a regression analysis on the data at hand to determine the relationship between market and state forces with tobacco consumption. Finally, it ends with policy suggestions.
2.Literature Review
2.1 Transition to Market Economies
The reintegration of the economies of the EEFSC implied a transformation from command economies to market economies. Communist countries were based on a centrally-planned economy (Tondel, 2001), in which trade flows were centrally planned, prices were set administratively (Metcalf, 1997), and trade flows were interdependent but not extended to the rest of the world (Metcalf, 1997). Instead, the transformation to a market economy entailed the creation of markets and privatisation of state owned enterprises (Gilmore, 2004a).
Regarding the modes of this transition, there was a fierce debate centred on the speed of reform, which was dominated by two schools of thought (Gilmore, 2004a). On one hand, the radical free market advisers, like Jeff Sachs (Shleifer, 1997) prescribed the so-called ‘‘shock therapy’’ policy (Stuckler et al., 2009), which entailed a rapid and extensive shift to capitalism based on three major elements: price liberalization, stabilization, and privatization (Stuckler et al., 2009) (Shleifer, 1997).
The “gradualist” or “institutionalist” approach, on the other hand, advocated for a gradual transition, advising nations to gradually introduce markets and private property while giving them time to build the institutions and infrastructures necessary to make markets function effectively (Stuckler et al., 2009).
In most countries, based on the suggestions of the global financial institutions, particularly the US Treasury and the International Monetary Fund (IMF) (Gilmore, 2004a), the shock therapy approach was adopted (Stuckler et al., 2009). However, the degree of adoption of this approach resulted in an uneven transition in EEFSC. In fact, based on the integration that the countries achieved within 15 years since the fall of the Berlin Wall, three group of countries are identified by the World Bank (WB) (Brodman, 2005).
The first group is made of the eight countries of Central and Eastern Europe (EU 8) that have become members of the EU (European Union) and have thus completed integration into the world economy (Brodman, 2005). The second group is made of countries of South-Eastern Europe (SEE) that were participating in the stabilization process and whose integration into the world economy was in between the other two groups (Brodman, 2005). Lastly, the third group is made of the 12 countries of the Commonwealth of Independent States (CIS) that have achieved much less
DV410 31699
integration, and as of 2005, were still not members of the World Trade Organization (WTO) (Brodman, 2005).
Figure 1: EEFS by Group Classification

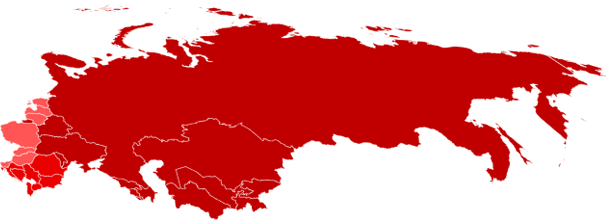
Overall, as a result of the shock therapy, in the early years of the transition, many countries in the EEFSC adopted liberal import policies (Ahmad & Yang, 1998) by cutting tariffs and reducing or eliminating nontariff barriers (Brodman, 2005). On average, after the transition tariffs ranged from 3.3% to 11.6%, being favourable with respect to those of developing countries at comparable income levels (Brodman, 2005). On average the EEFSC’s total merchandise exports and imports in 2005 accounted for more than 25% of GDP, as compared to about 15% in 1994. However, despite the evidence reported by Brodman (2005), it has to be accounted that there is significant variation across EEFSC and the year 1994, according to Metcalf (1997) evidence, could serve as a biased baseline year due to decreased interrepublic trade. In terms of privatization, the former communist bloc saw the sale of 60,000 medium- and large-scale businesses and hundreds of thousands of small businesses to private owners in less than ten years (Gilmore, 2004a). This was almost ten times as many privatizations as were observed throughout the rest of the world in the previous ten years (Gilmore, 2004a).
2.2 FDI
FDI can be defined as an “investment involving a long-term relationship and reflecting a lasting interest and control of a resident entity in the source country” which occurs with the “purchase of the physical assets or a significant amount of ownership” (Ahmed, 2013). FDI is used as a corporate strategy to promote the internationalisation of activities (Ahmed, 2013) and to complement or substitute the existing trade (European Commission Eurostat, 2013).
DV410 31699
FDI started growing particularly from the 1980s (Ahmed, 2013) (Drahokoupil, 2008), with an annual rate of growth of the stock of outwards FDI of 19.8% between 1986 and 1990 (Drahokoupil, 2008). This was the result of the effort of international financial institutions, most notably the WB, to promote economic governance that reflected neoliberal economic ideas (Drahokoupil, 2008).
In the former communist countries, there was virtually no FDI between the 1930s and the 1980s. In fact, the capitalistic motive of foreign investors could not be integrated in the communist ideology and in the central planning system of the USSR (Meyer & Pind, 1998). It was with the transition to a market economy (Meyer & Pind, 1998) (Svetličič & Rojec, 1998), that FDI started to be made in considerable quantities by western multinationals.
Both the world trend of investing internationally and the need of the communist countries to transition to a market economy took shape in a general consensus on the need for these countries to attract FDI to achieve a successful transition (Bitzenis, 2009) (Drahokoupil, 2008). In reality, it was thought that FDI into transition economies may support economic expansion, encourage technological advancement, hasten corporate reorganization, and ease capital account burdens (Lewandowski, 1997) (Bevan & Estrin, 2004), such that FDI were considered as a developmental panacea for EEFSC and as a new Marshall plan (Drahokoupil, 2008).
Despite low initial investments in the area (Drahokoupil, 2008) due to a high perceived risk (King & Sznajder, 2006), multinational company started to see an opportunity in the ex-socialist economies because of the ability to satisfy the lack of consumer goods and to provide western brands, that were already well-recognized due to the high western media penetration (Tondel, 2001) (Bitzenis, 2009). Between 1994 and 2004 FDI had grown considerably faster than trade, leading some to argue that ‘‘globalisation of production’’ outweighed ‘‘globalisation through trade’’ in economic importance (Gilmore, 2005). These FDI flows were primarily coming from continental Europe, although the US (Tondel, 2001), Japan, and the UK(Bevan & Estrin, 2004) were also seen as significant global actors Investments were particularly attracted by high GDP, transparent tax system, political and economic stability (Deacon, 2000), institutional infrastructure, as well as the bureaucracy and the local policies (Tondel, 2001) (Bevan & Estrin, 2004). This led to an uneven distribution of FDI across the EEFSC. In addition, a prospective membership in the EU was an incentive for investments (Bevan & Estrin 2004)
2.3 Tobacco Companies Investments
Within the trend of privatization and of FDI, transnational tobacco companies (TTC) were no exception. In fact, TTC were able to enter the market either by exporting to the market – facilitated by trade liberalization- or by producing in the market – through FDI and privatisation of state owned
DV410 31699
tobacco monopolies (Gilmore et al., 2011). However, liberalisation of inward investment has ultimately been more important than trade liberalisation (Gilmore, 2004b). In fact, since state owned tobacco monopolies were privatized in the recent years of the transition, sometimes at the pressure of the IMF, (Perlman et al., 2007) (Gilmore and McKee, 2005) (Gilmore et al., 2011), TTC were able to purchase tobacco factories (Bobadilla et al., 1997).
This scenario represented an opportunity of profit for TTC (Grogan, 2006), due to the undersupply but large size of the tobacco market in EEFSC (Gilmore, 2004a) (Zatoński & Zatoński, 2016). In fact, when the USSR collapsed, the centrally funded subsidies had ended and the centralised tobacco system broken down (Ross, 2004), leading to a shortage of supply of cigarettes production and high prices, that led to smokers’ rebellions (Gilmore, 2004a) (Gilmore, 2004b) (Bobadilla et al., 1997) (Gilmore and McKee, 2005). In addition, at the time EEFSC ranked as the world’s second largest cigarette market due to a young and large population, demographic growth, and high TC (Gilmore, 2004a) (Danishevski et al., 2008).
As a result, the main TTC, like British American Tobacco (BAT), RJ Reynolds, Philip Morris rapidly took advantage of this situation (Ross, 2004) building their strategy in the EEFSC around the acquisition of the extensive tobacco manufacturing firms and by investing in the country (Gilmore, 2004a) (Hayes & Ciobanu, 2013).
More than US$2.7billion were invested in the FSU between 1992 and 2000 (Gilmore, 2004a) (Gilmore, A.B. and McKee, 2004c) and the contribution of these tobacco investments to total FDI ranged from around 1% to over 30% (Gilmore, A.B. and McKee, 2004c). In Central and Eastern Europe, TTC had large stakes in 34 former state monopolies by 1997; 12 of these were held fully (Bobadilla et al., 1997). In 2004 foreign owned factories even peaked to account for between 60% and 90% of the tobacco market (Gilmore, 2004b).
Because the competition to acquire assets was intense (Gilmore & McKee, 2005), since all TTC were aiming to establish a monopoly position in most countries as possible, there was an immense pressure to be rapid (Gilmore, 2004a). This resulted in very aggressive strategies (Gilmore, 2004a), based on massive marketing campaigns and launching products that could attract more customers (Hurt, 1995) (Perlman et al., 2007) (Gilmore, 2004b). These massive advertising campaigns linked tobacco products with a glamorised western lifestyle (Hurt, 1995) (Bobadilla et al., 1997), creating a fashionable status around the consumption of a western cigarettes (Gilmore, 2004b). In fact, TTC brands symbolised more individuality or personal freedom (Gilmore & McKee, 2005). Campaigns were launched massively, targeting especially women (Gilmore, 2004a) (Grogan, 2006). Marketing campaigns even had greater effects than in western countries, since most of EEFSC had not been
DV410 31699
exposed to advertising before, so that people were more sensitive and responsive to it (Bobadilla et
al., 1997).
The levels of cigarette advertising that resulted were phenomenal and took various shapes, ranging from slogans around cities, young brand representatives handing out free products, prizes and events (Grogan, 2006) (Kholmogorova & Prokhorov, 1994). By the mid 90s in at least four of the newly independent states TTC ranked among the top three advertisers. According to the industry, advertising for cigarettes was found on up to 50% of all Moscow billboards and 50% of all Russian plastic bags (Gilmore, 2004a).
2.4.3 Weak Legislative power
Because of strong lobbying and corruption activities pursued by TTC, the legislative power of the state to stipulate restrictions was low (Perlman et al., 2007). This was also sided by a strong legislative focus on basic state building and the need to develop a constitution (Gilmore, 2004b). As a result, the government occasionally struggled to enact legislation to control tobacco use and safeguard residents from its negative effects. In Uzbekistan, for instance, BAT was able to overcome national tobacco laws after already reversing a prohibition on advertising in the nation’s capital (Gilmore et al., 2011). Additionally, BAT changed the Uzbek tobacco taxation structure in order to strengthen its monopoly, lessen competition, and eventually increase sales revenues (Gilmore, A. et al., 2007a) (Gilmore et al., 2011). In 1993 the Moscow City Council took its own action to ban tobacco advertising, and a similar ban passed in the Russian Parliament, to then be refused by the Press Ministry (Bobadilla et al., 1997). In addition, in 1995 the Duma considered two versions of an anti-smoking advertising law of which the weakest was approved (Ross, 2004).
2.4.4 Weak Executive power
Adding to the inability of some states to implement laws, was the inability to enforce them (Ross, 2004). In fact, due to weak political leadership, tobacco control was not strongly enforced and easily avoided and undermined by TTC (Gilmore et al., 2011) (Hurt, 1995) (Ross, 2004). In fact, some bans did exist, but post-transition TTC exploited confusion over the legality of Soviet legislations to disregard them (Gilmore, 2004b) (Hurt, 1995) (Bobadilla et al., 1997) (Gilmore et al., 2011) (Danishevski et al., 2008).
DV410 31699
In 1995 in Hungary, for example, TTC had violated tobacco advertising bans in almost all media (Gilmore et al., 2011). Further, despite the ban on distribution of free cigarette samples, in Russia, 17% of students had been offered free cigarettes by company representatives (Ross, 2004). In addition, in Russia advertising of tobacco, despite a ban, was present on billboards and on television in Moscow (Bobadilla et al., 1997).
2.4.5 Welfare
When the state was not able to confront TTC at first, actions on the consequences could be implemented in supporting citizens with welfare. However, at the time most states were unstable and state building was in place, such that the welfare to citizens was low and the health system was weak. In the first ten years of the transition the welfare spending on average increased in western European countries while stagnated or decreased in Eurasia (Orenstein & Haas, 2002) (Deacon, 2000). In particular, in 1990 expenditures on health in Russia ranged from 3 to 4% of GDP as compared to the 8-9% in Western European countries, considering as well that Russian GDP was lower (Shkolnikov et al., 1998). This under provision even resulted in healthcare (Rechel et al., 2013) (Meslé, 2004) (King & Stuckler, 2007) (Shkolnikov et al., 1998), which faced further disruption in the transition (Deacon, 2000). As a result, that weakness of the healthcare system was one of the principal factors in the long-term deterioration of health status in Russia (Shkolnikov et al., 1998).
2.5 Outcomes of the Transition
In the transition period, some negative outcomes were observed both in economic and in health terms (Gilmore et al., 2011). Although some successes has been noticed in central and eastern Europe, even some of the strongest advocates of the shock therapy now argue that the consequences of the policy for EEFSC, and especially CIS, were largely disastrous (Gilmore, 2004a) in the years after the transition. The literature attributes most of these negative outcomes to the market, in terms of FDI, trade liberalization and mass privatization, rather than the state.
2.5.1 Health Outcomes
In addition to a well recognized economic deterioration, due to decline in GDP (Tondel, 2001) (Georgieva et al., 2002), increase in unemployment (Gilmore et al., 2011) (Rechel et al., 2013) (Skafida et al., 2014) (Svetličič & Rojec, 1998), increase in inflation (Gilmore et al., 2011), increase in rents (Deacon, 2000), decline in income (Deacon, 2000) (Georgieva et al., 2002), increase in
DV410 31699
inequality (Deacon, 2000) (Rechel et al., 2013) (UNDP, 1999) and increase in poverty (Tondel,
2001), even health deteriorated.
In fact since the 1990 it was recorded a dramatic decrease in life expectancy (Tondel, 2001)(Macura et al., 2005) (Bobadilla et al., 1997) (Shkolnikov et al., 1998) (Earle & Gehlbach, 2011) (Rechel et al., 2013), particularly accelerating in 1993 and 1994 (Meslé, 2004). This drop is life expectancy was mainly affecting male adults (King & Stuckler, 2007) and was attributable to accidents, homicides, suicides, alcohol poisoning (Bobadilla et al., 1997) (Shkolnikov et al., 1998) (Tondel, 2001) (Stuckler et al., 2009) (Leon et al., 2007) (Gavrilova et al., 2002), as well as circulatory and cardiovascular diseases (Bobadilla et al., 1997) (Tondel, 2001) (Shkolnikov et al., 2001). Circulatory and cardiovascular diseases were largely claimed by smoking (Bobadilla et al., 1997). According to the estimates, in one group of NIS countries about 25% to 30% of all male deaths and about one in two cancer deaths were due to smoking (Bobadilla et al., 1997). This was due both to the high TC of the EEFSC and the higher carcinogenicity of the sold products compared to the ones of the USA or Western Europe for the same brand (Bobadilla et al., 1997).
2.5.2 Determinants of the Outcomes According to the Literature
The literature tends to attribute health outcomes largely to the market rather than the state. In fact, the decrease in life expectancy tends to be attributed to the shift to a market economy and its consequences. Stuckler et al. (2009) Bobak & Marmot (2009) Shkolnikov et al. (2001) Macura et al. (2005) identify as causes of the decline in life expectancy the strong economic crises, while King & Stuckler (2007) attribute it to mass privatization. Despite some papers identify the dismantling of institutions and public services, including health systems, as causes of decline in health (Stuckler et al., 2009) (Bobak & Marmot, 2009) (Meslé, 2004) (King & Stuckler, 2007) (Shkolnikov et al., 1998) (Meslé, 2004) (King & Stuckler, 2007) (Shkolnikov et al., 1998) (Macura et al., 2005), the phenomenon is still largely reconducted to mass privatization happening during the transition. In terms of TC, the literature is even more skewed towards the market, because of the aggressive strategies of TTC and their exploitation of the transition to enter in EEFSC. The literature tends to find itself in agreement on an increase in production (Gilmore et al., 2011) (Ross, 2004) (Bobadilla et al., 1997) (Gilmore, 2004b), shift towards western products (Ross, 2004) (Hurt, 1995) and increase in consumption (Gilmore, 2004a) (Roberts et al., 2013) (Bobadilla et al., 1997) (Gilmore et al., 2011) (Perlman et al., 2007) (Gilmore & McKee, 2005) (Gilmore, 2004b). In addition, most of the literature tends to attribute these trends to the market liberalization and the consequent entrance of TTC (Bobadilla et al., 1997) (Gilmore et al., 2011) (Perlman et al., 2007) (Gilmore & McKee, 2005) (Gilmore, 2004b) (Gilmore, 2004a) (Roberts et al., 2013) (Pomerleau et al., 2004) (Stuckler et al., 2009) (Gilmore et al., 2005) (McGrady, 2007) (Bettcher et al., 2001).
DV410 31699
However, the literature, produced until 2013, suffered from lack of accurate and comparable data on TC (Gilmore et al., 2001) (Perlman et al., 2007) (Bobadilla et al., 1997). Results were based on rough estimates and small sample sizes (Bobadilla et al., 1997) (Perlman et al., 2007) (Bobak, 2006), on which it was difficult to establish whether FDI entrance entailed an increase in TC and whether in those years TC increased (Perlman et al., 2007).
3.Theoretical Framework
This research positions itself within the state versus market theoretical debate. However, while the state versus market debate arose in the 50s and was economic, development here is assumed to be closer to a Sen (2001) perspective and in a more holistic view. This adaptation of the debate is justified by a trend of growing attention to aspects of development which go beyond economic improvement and industrialization, but towards the provision of basic needs and individual betterment (Chang, 2009). This is supported even by the focus of the Sustainable Development Goals (SDGs) (UN, 2018) and the UNDP’s human development index (HDI) on more aspects of development.
As a result, the debate is adapted in this research to mean development in terms of health. This attribution of development to health is in line both with Sen’s theory and with the current development indicators. In fact, according to Sen, “substantive freedoms (that is, the liberty of political participation or the opportunity to receive basic education or health care) are among the constituent components of development” (Sen 2001, p.5). This more humanistic approach (Chang, 2009) is even supported by the focus on health of the SDGs and HDI. In addition, because TC is considered as a risk factor to health (WHO, 2021), TC can be considered as a component and proxy of development.
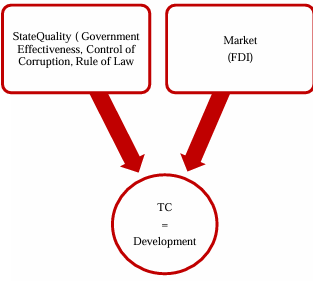
Figure 2: Process of Shift from Economic Development to TC


As a result, the state versus market debate would shape itself in determining whether it is the market forces or the state ones to shape TC, which affects health, which is a component of development. Since in this research the dichotomy of the state and market is not conceived only in economic terms, an interventionist states acts on more spheres other than import substitution, trade policies or tariffs, but also in terms of softening the effects of a free market on other developmental spheres. Setting this debate as the lens through which to read the literature on TC in transition countries, most of the papers (paragraph 2.5.2), to the best of the author’s knowledge, on health and TC seem to take the side of the market. In fact, in the existing literature the state has not been considered as a main driver of TC in the considered context.
DV410 31699
4.Research Aims
Despite the reasonable focus on the market, after years of solely presence of the state, this paper argues that the responsibility of the state during the transition has been largely undermined. In fact, while development outcomes, either positive or negative, are attributed in large part to the market economy, the state could have played a large role in shaping them, as explained in paragraph 2.4. Through the case study of transition economies of EEFSC, the aim is to test the state vs market theories with a new development lens. In fact, the transition economies offer a good scenario of a shift from a total presence of the state to the presence of the market which provides an interesting setting for the debate. As a result, this research wishes to answer the following research question: to what extent the market or the state have influenced TC during the transition in EEFSC? The research question is answered by running a regression which studies the correlation between TC and state and market forces. The regression has been chosen as an appropriate methodology to test the
correlations of the market and the state on the dependent variable and to quantify them. The market is studied in terms of FDI, which have been one of the main phenomena of trade liberalization and, hence, free market forces. The state is studied in terms of government effectiveness, control of corruption and rule of law. In fact, as highlighted in paragraph 2.4, it was mainly through the ability to implement policies, having control on corruption and having strong legislative and executive power, that the state could shape TC.
Figure 3: Potential Process of Causation In addition, this research seeks to analyse data using a new dataset created in 2019, which overcomes some of the data issues that have shaped past research.

DV410 31699
5. Data and Methodology
5.1Data
The variables considered for the model are TC, FDI, State, GDP, and Price. TC is the dependent variable and a proxy of development, since it represents how spread is the tobacco epidemic, not only in terms of smokers but also in terms of quantity. The TC variable is measured in terms of cigarettes consumed yearly per capita by the population. Data on TC per Capita was collected from Hoffman et al. (2019) database.
FDI is the independent variable and is a proxy of the market. FDI is considered no matter its origin and industry focus, because of the author’s will to study the relationship between more openness to the market, and hence greater presence of market forces, and development, not to study the effectiveness of TTC business strategy. FDI is used per capita, to account the inflow of FDI on the potential market size of the host country in which investments are done (Ferris et al., 1994). FDI is in real value in € at constant exchange rate, to account for inflation. Data on FDI was obtained from Euromonitor International (2022).
State is an independent variable and is a proxy of the state. State is an index of state quality, ranging from -2.5 to 2.5, which has been built averaging three of the World Bank (2022) six governance indicators: Government Effectiveness, Control of Corruption and Rule of Law. These three indicators have been chosen because of being the most representative, according to the literature (paragraph 2.4) to be influencing tobacco control. Governance Effectiveness measures “the quality of public services, the quality of the civil service and the degree of its independence from political pressures, the quality of policy formulation and implementation, and the credibility of the government’s commitment to such policies” (World Bank ,2022), the Rule of Law measures “the extent to which agents have confidence in and abide by the rules of society, and in particular the quality of contract enforcement, property rights, the police, and the courts” (World Bank, 2022) and Control of Corruption measures “the extent to which public power is exercised for private gain, including both petty and grand forms of corruption, as well as “capture” of the state by elites and private interests” (World Bank, 2022). GDP has been inserted as a macroeconomic indicator to control both the purchasing power of citizens (Ferris et al., 1994) and because it is a determinant of smoking habits (Kislitsyna et al., 2010) (Gilmore et al., 2001) (Bobak, 2006) (Perlman et al., 2007) (Ross, 2004). GDP is in real values in € at constant exchange rate, to account for inflation. Data on GDP were obtained from Euromonitor International (2022).
Price is inserted in the model as a macroeconomic indicator to control for the price elasticity of tobacco, which could shape the decisions of smokers on their habits. Despite research in the area having reported high price inelasticity (Grogan, 2006), this dissertation had the desire to control for this variable. Price of Tobacco is an index estimated using a sample of prices for a defined set of goods from tobacco, setting 2010 as a base year for determining the price index. Data on tobacco price was obtained from Euromonitor International (2022).
DV410 31699
GDP and Tobacco Price are not considered as proxies of the market, since they are macroeconomic variables that have the same base in all states and that include aspects not related to the market. In fact, GDP is composed of consumption, government expenditures, country’s investments, and net exports. Even prices are not determined only by the market, but as well by business strategies and government regulations. As a result, these variables can not be proxies neither of the state or the market but serve as control variables.
5.2 Data Reliability
The researched topic presented data scarcity, particularly for TC and state quality. The available data with best quality and reliability were selected, even if presenting some limitations. Hoffman et al. (2019) database, which contained data from 1970 to 2015 on TC, had data collected through a systematic search and consultations with experts and its quality appraisal was conducted. This dataset was chosen because of the ability, as compared to the IHME, to capture discontinuities in the data. Euromonitor International bases its estimates on multiple sources including information from national statistics, EUROSTAT, UN, IMF, OECD, International Financial Statistics, and its own estimates. Euromonitor is a harmonised source of data across countries. Although it is frequently used, it has been highlighted that it is a private product and hasn’t, to the author’s knowledge, been the subject of an independent examination of data quality. The World Bank (2022) governance indicators were collected from 1996. The WB reports data on aggregate and individual governance indicators, based on the views of many enterprise, citizens, and experts survey respondents in industrial and developing countries. They are based on over 30 individual data sources produced by a variety of survey institutes, think tanks, NGOs, international organizations, and private sector firms (World Bank, 2022). Despite the reliability of the source, the availability of data since 1996 and missing values are a clear limitation of the dissertation. As a result, the imputation of missing value has been treated with the median.
5.3 Dataset
The selected data formed an unbalanced panel dataset, from 1990 to 2003, of 20 countries. 1990 was selected as a start date since the Berlin Wall had already fallen, and the USSR was on the verge of being terminated. In addition, 1990 represented a feasible year in terms of data availability. The year of 2003 was instead chosen, because of its symbolic value, since it held the adoption of the WHO Convention on Tobacco Control, but the convention was not yet entered into force and not yet ratified by countries. Lastly, 2003 was the last year before the entrance of some of the considered countries in the EU. In 2004 Bulgaria, Czech Republic, Estonia, Latvia, Lithuania, Poland, Slovenia and Slovakia entered the EU, while Bulgaria and Romania followed in 2007 and Croatia in 2013. In fact, the WHO convention and the accession to the EU (Skafida et al., 2014) could have shaped investments and tobacco control policies in EEFSC (Hayes & Ciobanu, 2013).
DV410 31699
The selected countries were chosen based on data availability. A total of 20 countries, of which 8 countries of the EU-8, 7 countries of the SEE and 5 countries of the CIS (Brodman, 2005), were included. The countries excluded from the regressions, according to the WB definition, consisted in Armenia, Georgia, Kyrgyzstan, Moldova, Tajikistan and Turkmenistan, being all of them CIS countries (Brodman, 2005). This exclusion of CIS countries represents a limitation of the dissertation and was determined by the lack of data. Countries that were part of Yugoslavia were considered with the current state definition, to have more clarity around countries policies.
Table 1: List of Considered Countries
Country Country Code Group N. of Observations
Azerbaijan AZE CIS 286
Belarus BLR CIS 266
Bosnia and Herzegovina BIH SEE 265
Bulgaria BGR SEE 309
Croatia HRV SEE 292
Czech Republic CZE EU-8 301
Estonia EST EU-8 296
Hungary HUN EU-8 312
Kazakhstan KAZ CIS 289
Latvia LVA EU-8 297
Lithuania LTU EU-8 293
Montenegro MNE SEE 230
North Macedonia MKD SEE 276
Poland POL EU-8 312
Romania ROU SEE 310
Russia RUS CIS 295
Serbia SRB SEE 248
Slovakia SVK EU-8 300
Slovenia SVN EU-8 297
Ukraine UKR CIS 294
5.4 Empirical Model
To analyse the data a fixed-effects model regression with 90% of confidence interval is run. This model has been chosen because of the desire to account for country-level characteristics that could influence TC. This was viewed as being more conservative but still desirable because between country differences could be cofounded by country-specific, time-invariant, unobserved characteristics that related to TC. The choice was even confirmed by the use of the fixed effects model in similar research (Mendez Lopez et al., 2017) (Chaloupka & Laixuthai, 1996) and by the Hausman (1978) specification test (table 4). In addition, this model would be able to overcome the mistakes that Gerry et al. (2010) identified in Stuckler et al. (2009) paper, which studied the impact of privatization on life expectancy in transition countries .
DV410 31699
The resulting equation of the regression would be as follow
Equation 1: Regression Equation with Variables
t𝐶𝑖,𝑡 = 𝛽0 +𝛽1𝐹𝐷𝐼𝑖,𝑡 + 𝛽2𝑆𝑡𝑎𝑡𝑒𝑖,𝑡 + 𝛽3𝐺𝐷𝑃𝑖,𝑡 + 𝛽4𝑃𝑟𝑖𝑐𝑒𝑖,𝑡 + 𝑣𝑖 + 𝜀𝑖,𝑡
Where i is the country and t is the year. TC is TC per capita in quantities, FDI are FDI per capita in €, GDP is GDP per capita, Price is the index of tobacco prices, State is an index of state quality, v is the error term denoting country fixed effects and ε is an identically distributed random error term to capture the omitted variables. All the statistical analyses are conducted using StataSE 17.
6. Results
6.1 Preliminary Evidence
6.1.1 Descriptive Statistics
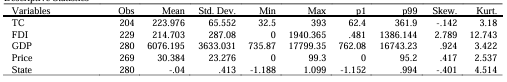
The descriptive statistics (table 2) shows that TC varies from 32.5 cigarettes per capita to 293 cigarettes per capita per year, with skewness slightly on the left and kurtosis around 3 meaning that the distribution is almost even. FDI range from €0 to €1940 per capita per year. For FDI skewness is positive and around 2, meaning that there are fewer countries that received lower levels of investments. However, FDI distribution is leptokurtic, around 13, so that that most of the values of the variables fall close to the median, meaning that there are few outliers. GDP per capita ranges from €736 to €17,799 with slight skewness on the right kurtosis around 3. Overall, the distribution of GDP is mesokurtic meaning that there are not many outliers. Price ranges from 0 to 99 and is slightly skewed on the right with a kurtosis lower than 3, meaning that the countries are sparser on the distribution. Lastly, State has the minimum at -1.1, while the maximum at 1.0. The mean is negative connotating that the considered countries are performing bad in terms of state quality since the index ranges from -2.5 to 2.5. State is skewed on the left, meaning that there more countries with low state quality but the distribution is leptokurtic meaning that most of the countries fall around the median.
DV410 31699
Table 2: Descriptive Statistics
Descriptive Statistics

6.1.2 Correlation
The pairwise correlation shows that TC is slightly correlated with the State and GDP, while not with FDI and Price. In addition, Price seems, even if not significantly, negatively correlated, meaning that a lower price would entail slightly lower TC. Another interesting aspect is that here the State is positively correlated with TC, meaning that a better state would have higher TC. However, despite the useful insight of these preliminary evidence, these results are not statistically appropriate to draw conclusions on the research questions.
This correlation is useful to control for issues of multicollinearity between explanatory variables. There exists a correlation between FDI and the other explanatory variables, which can be explained by the self-selection of investments. In fact, countries performing well were likely to attract more investments (Deacon, 2000) (Tondel, 2001) (Bevan & Estrin, 2004). In addition, the correlation between FDI and GDP can even be explained by the fact that countries with higher GDP would require higher investments. There exists a correlation between GDP and Price, which can be explained by higher cigarettes prices in wealthier contexts. The correlation between GDP and the State can be explained by the fact that well performing states tend to be richer. While there are some correlations among explanatory variables, especially GDP and FDI, correlations are always lower than 0.6, not representing an issue for the regression analysis.
Table 3: Pairwise Correlation
Pairwise correlations


6.1.3 Robustness Check
Robustness checks are conducted prior running the regression to control for the choice of the model. Fixed effects estimators are preferred to correct for country-specific conditions that could influence TC, as supported by Hausman (1978) test (table 4). Results confirm the need for more conservative fixed effects estimates as compared to the random ones. In fact, since the p-value is 0 we can reject the null hypothesis, where the null hypothesis is accepting random effects, while the alterative hypothesis is accepting fixed effects.
DV410 31699
Table 4: Hausman Specification Test
Hausman (1978) specification test
Coef.
Chi-square test value 33.579
P-value 0
6.2 Trends and Subgroups Characteristics
6.2.1 TC
Despite the literature reporting an increase in TC in the years after the transition, the dataset of Hoffman et al. (2019) allows us to observe a different trend. In fact, TC, on average, has decreased in transition countries after 1990 (figure 7). In fact, in 1990 the TC average was 264 cigarettes, to then fall to 194 in 1996 and rise again in 2003 at 231 cigarettes (Hoffman et al. 2019). However, every country follows a very country specific trend and trend similarities among countries are few. While in the years 1997 to 2001 more heterogeneity is observed within countries, it appears that this difference smooths closer to 2003 (figure 7). The countries that go against the trend of decreasing TC are Bulgaria, Kazakhstan, Russia, Romania, and Ukraine (figure 4). The increasing TC in Bulgaria may be due to very aggressive TTC strategies which entailed strong lobbying and contact with political leaders (Skafida et al., 2014). The significant target that Russia and Ukraine represented to TTC, followed by Kazakhstan, can be used to explain the trends (Gilmore, 2004c).
In fact, in these three countries tobacco money accounted for over 4% of FDI (Gilmore, 2004c). Romania’s trend can be explained by the high influence of TTC and by the inability of the government to apply tobacco provisions (Hayes & Ciobanu, 2013). Looking at the countries, instead of the years (figure 6), we can observe that the larger tobacco consumers over the period 1990-2003 are Bulgaria, Hungary, Poland, and Slovenia. Bulgaria, Hungary, and Poland are even among the countries that recorded more heterogeneity within the years (figure 6). While Hungary and Poland follow a similar trend of decreasing TC, in Bulgaria it increases while in Slovenia it remains stable (figure 4).
In fact, high TC in Bulgaria was due to an increasingly aggressive strategy of TTC in lobbying and on political leaders (Skafida et al., 2014) which kept being an influence over the years. In Hungary and Poland instead, the initial high TC was linked to cultural and historical determinants and was then challenged by strong governments. In fact, Hungary was able to implement regulations on advertising, rules on consumption, and warning labels (Szilagyi, 2002). Similarly in Poland, the high TC was challenged through a strong government able to
DV410 31699
implement regulations despite a strong influence and investment of TTC in the area, which would have forecasted an increase of TC in the area by 10-20% (Zatoński et al., 2016). In fact in 1990 the Hungarian government launched a health awareness campaign and in 1995 and 1999 passed tobacco legislations (Zatoński et al., 2016) (Jassem et al., 2014) (Zatoński et al., 2016). Slovenia instead has had more stability in the trends related to TC because of less dynamicity on tobacco control measures compared to Hungary and Poland (Joossens & Raw, 2007).
Looking at countries’ subgroups (figure 5), it is possible to notice a common trend until 1996, which changes after 1996. In fact, EU-8 TC decreased while SEE and CIS consumption increased again after 1997. In fact, the EU-8 countries have experienced a decrease in consumption probably due to better governments that overtime implemented laws and regulations, as in the case of Poland, or comply, around the 2000s, with the European Union approach to tobacco. In fact, EU countries took part in conferences on health and tobacco in 2002 (Zatoński et al., 2016) and had to comply with EU legislations. In fact, the European Parliament and Council in 2001 and 2003 regulated tobacco (Hayes & Ciobanu, 2013) (Joossens & Raw, 2007) and countries in the process of joining the EU had the obligation to align national legislation and standards to the EU ones (Hayes & Ciobanu, 2013) (Szilagyi, 2002) (Skafida et al., 2014).
Figure 4: TC per Country 1990-2003
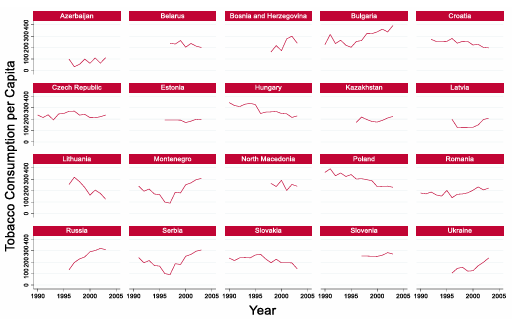

Data Source: Hoffman et al. (2019)
DV410 31699
Figure 5: TC by Subgroups of Countries 1990-2003
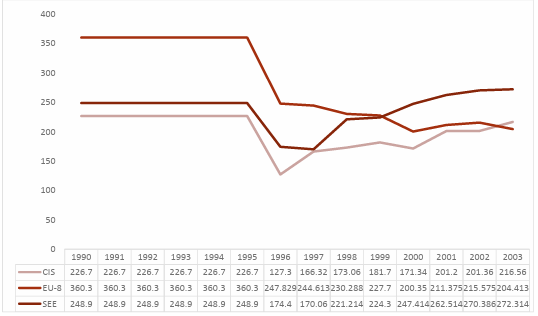

Data Source: Hoffman et al. (2019)
Figure 6:TC Years Average per Country 1990-2003
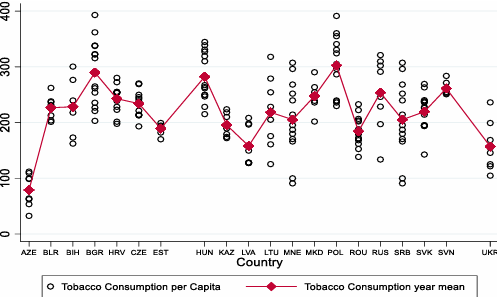

Data Source: Hoffman et al. (2019)
DV410 31699
Figure 7: TC Country Average per Year
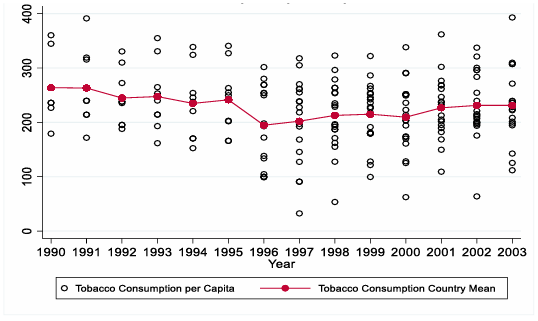

Data Source: Hoffman et al. (2019)
6.2.2 FDI
FDI per capita have increased in the considered period, in line with the literature that identified an increase in investments after the fall of communism (paragraph 2.2). Heterogeneity between countries increases with time, meaning that FDI particularly concentrated in some countries (figure 10). In fact, from graph 8 it is possible to observe that, while countries have a similar and low starting point of FDI in 1990, the trends diverge with time, with some countries, like Belarus, Bosnia and Herzegovina, Kazakhstan, Romania, Russia, Serbia, and Ukraine, recording lower investments, and other countries, like Czech Republic, Estonia, Hungary, Slovakia, and Slovenia spiking in terms of investments. This subgroup division is even supported by graph 9 which shows that EU-8 over time attracted a higher size of investments as compared to the other groups, in particular Czech Republic, Estonia, Hungary, and Slovakia.
This can be explained by their attractiveness for investors (Deacon, 2000) and their prospective EU membership. In fact, (Bevan & Estrin, 2004) empirical work indicates that the announcement about the EU accession proposal has an impact on the size of FDI for the future member countries. Compared to CIS and SEE, EU-8 have presented more fluctuations with steady decline in 2003. This final drop is partly explained by the dissipation of inflows from privatisations by the end of 2000s and the distribution of most of the income as dividends (European Commission. Directorate General for Economic and Financial Affairs, 2019).
DV410 31699
Comparing FDI trends to the tobacco ones, it is possible to notice that the group of countries that received more investments at first were the ones with higher tobacco per capita, that is the EU-8. However, the tobacco and FDI trends tend to be dissimilar in their shapes.
Figure 8: FDI per Country 1990-2003


Data Source: Euromonitor International 2022
Figure 9: FDI by Subgroups of Countries 1990-2003
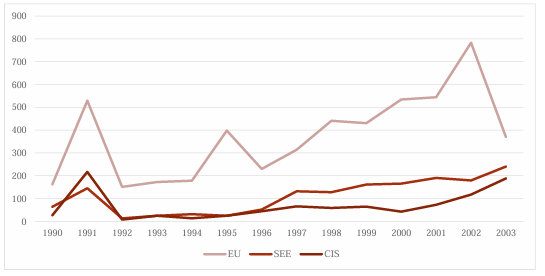

Data Source: Euromonitor International 2022
DV410 31699
Figure 10: FDI Years Average per Country 1990-2003
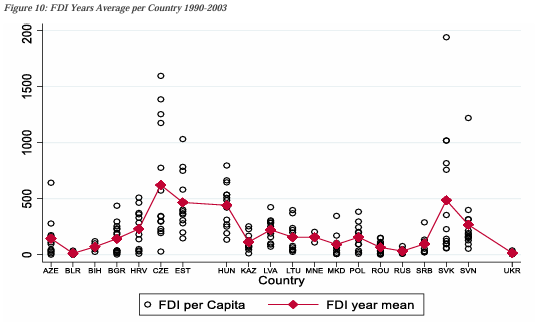

Data Source: Euromonitor International 2022
Figure 11: FDI Country Average per Year
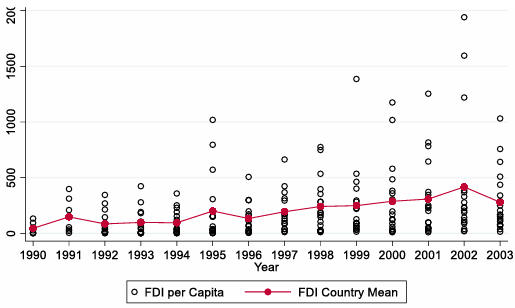

Data Source: Euromonitor International 2022
DV410 31699
6.2.3 State
For state quality, different graphs are studied since they are considered more explicative because of missing data issues. Countries with higher state quality are EU-8, which is the only group that on average between 1996 and 2003 stood above 0, where CIS scored the lowest grade (figure 12). Looking at the specific countries who perform best (figure 13), these are all EU-8: Czech Republic, Estonia, Hungary, Poland, and Slovenia. These countries performed particularly well in terms of government effectiveness and rule of law. Comparing this score with the tobacco control performance, it is possible to observe that these countries performed quite well even in terms o tobacco legislations. In fact, these countries, except for Czech Republic, were stronger in terms of enacting tobacco control (Joossens & Raw, 2007). Czech Republic represents an exception in terms of tobacco legislation because it had a strong industry presence and strong negative attitude towards tobacco control.
On the other hand, Azerbaijan, Kazakhstan, Serbia, and Ukraine are the worst performing countries. These countries fared very poorly in terms of control of corruption and rule of law.The low performance in Azerbaijan and Kazakhstan can be explained by their richness in natural resources and because of their autocratic nature (Gilmore, 2004b) (Brodman, 2005) (Meyer & Pind, 1998). Low grade for Serbia can be accounted for by the political conflicts, for its state definition and independence, that prevailed throughout the time period under consideration. Ukraine’s low rating can be attributed to the country’s lack of political stability, rise in corruption, and significant economic downturn following the end of communism.
Figure 12: State Quality by Subgroups of Countries 1990-2003


Data Source: WB 2022
DV410 31699
Figure 13: State Quality Years Average per Country 1990-2003
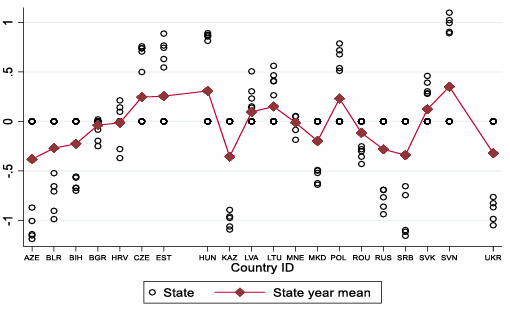

Data Source: WB 2022
6.3 Regression analysis
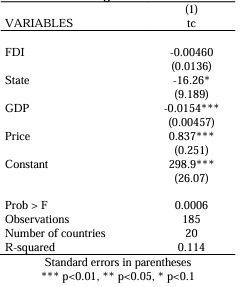
Table 5: Regression Analysis
Regression

DV410 31699
The number of considered states in the panel data fixed effects regression is equal to 20. The considered variables are 5 and the number of observations is equal to 185. The regression analysis overall is valid with a F close to 0. The resulting regression equation would be as follow
Equation 2: Regression Equation with Coefficients
T𝐶𝑖,𝑡 = 298.9 − 𝛽10.00460𝑖,𝑡 − 𝛽216.26𝑖,𝑡 − 𝛽30.0154𝑖,𝑡 + 𝛽40.837𝑖,𝑡 + 𝑣𝑖 + 𝜀𝑖,𝑡
6.3.1 The Impact of FDI on TC
FDI seem to have a negative effect on TC (-0.00460), but this has no effects on our regression since it is not significant at a 90% confidence interval. This result means that opening to FDI did not have a significant effect in driving up TC. This result was overall supported even by the graphs which showed an overall increase in FDI not corresponded by an overall increase in TC. This means that, even if TTC entered in the market in transitioning countries through FDI, it has not been the market liberalization per se, happening through FDI, to lead to TC. In fact, some countries that attracted considerable investments, like Estonia or Slovakia, did not experience an increase in TC. On the other hand, some countries less attractive to FDI, like Russia and Ukraine, experienced an increase in tobacco.
6.3.2 The Impact of state on TC
The state is negative and significant in explaining TC (-16.26). In fact, a 1-point increase in the state quality index reduces TC by 16 percentage points. As a result, better state quality, through better governance, control of corruption and rule of law could reduce the smoking behaviour of citizens. This result is in line with the literature review (paragraph 2.4), which identified the role of the state in intermediating the investments of TTC. In fact, in the case of Poland, despite TTC investments,state policies inhibited TTC operations such that R.J Reynolds factory went bankrupt (Zatoński, 2016).
6.3.3 The impact of Macroeconomic Variables on TC
Our main macroeconomic variables, namely the GDP and Price, are significant in explaining TC. While a 1-point increase in GDP per capita would decrease TC by -0.0154 percentage points, a 1 point increase in price index would increase TC by 0.837 percentage points. High GDP is correlated to lower TC because of social determinants of health (Kislitsyna et al., 2010) (Gilmore et al., 2001) (Bobak, 2006) (Perlman et al., 2007) (Ross, 2004) or because it is actually smoking to impact the productivity of a country (Rezaei et al., 2016), since causality can not be controlled for. Price of tobacco is correlated to higher TC probably due to pricing strategy of enterprises or higher price controls in most affected countries. Price inelasticity is observed, of which an example is Russia where in 2000 tobacco taxes were increased by 100% (Ross, 2004), but consumption still increased by 3,6% between 2000 and 2001 and by 5,9% between 2001 and 2002 (Hoffman et al., 2019).
DV410 31699
7.Policy Implications
The data analysis shows us that, while FDI are not correlated to TC, state quality is correlated at a 90% confidence interval. Consequently, the regression analysis, despite some limitations, would lead to the conclusions that it is not the market forces that influenced health outcomes, and development, but rather the state. This result comes in support of the state in the debate. In fact, while the market has not influenced health, meant as a development indicator, the state may have through its government effectiveness, control of corruption and rule of law and its consequent ability in managing the shift to the market economy, compensating with policies for the externalities of harmful investors. A perfect example is Poland, which received high investments but, because of a high state quality, was able to control tobacco with policies.
These results lead to policy implications on the importance of the state for development. The first main implication concerns the role of the state in general in determining TC and the essential role that it should play to account for negative externalities of harmful products. The state should have strong power to be able to implement policies that have at stake the wellbeing of citizens, by controlling corruption, implementing policies, and having a strong legislative and executive power. While this is not an easy task to accomplish, the literature suggests to create better and equal access to justice, foster legal empowerment and literacy, strengthen the capacity of civil society to engage in dialogue (OECD, 2019), implement anticorruption laws and institutions, and increase accountability and transparency to increase government effectiveness.
A second implication concerns the importance that institutions and the state play in moments of transition. Being the transition from communism to market economy a very specific scenario in history, countries that are in a stage of transit should not disregard the role that institutions play, as the shock therapists did. In fact, countries that are still closed and isolated economically, like Democratic People’s Republic of Korea or Russia after the war with Ukraine, if liberalizing in the future and opening to foreign investments, must bear in mind the importance of the state and intermediation of market forces for development. Therefore, the speed of the liberalization should account for the readiness of the state and institutions and their strength, when discussing in roundtable talks the costs and benefits of different approaches of transitions.
Another implication concerns the importance of data collection. Lack of data for this study highlights the importance of improvement of data collection systems through better government transparency and compliance with the SDG 17.18 on the development of better statistical systems (UN, 2018). Collection of data through surveys (Skafida et al., 2014), and surveillance are needed to provide accurate and comparable data on TC, smoking prevalence, knowledge and attitudes about smoking, mortality and morbidity data, which can capture as well the consumption of smuggled products.
8.Limitations
The empirical results are to be considered with limitations coming from data availability and the research design. The availability of data for the purpose of the research was limited, as observed even by previous researchers (Gilmore et al., 2001) (Perlman et al., 2007) (Bobadilla et al., 1997) (Bobak, 2006). In fact, the data on TC of Hoffman et al. (2019), despite its reliability as compared to other available data, still suffered from the lack of data from national statistical agencies and relied on the accuracy and precision of each country’s data collection. The dataset was only able to capture tobacco under the form of cigarettes, disregarding other forms of consumption like chewing tobacco (Hoffman et al., 2019). In addition, data might underestimate smuggling in the considered countries, which according to (Ross, 2004) ranges around 4% or 5% of the foreign cigarettes market. In addition, the dataset has not considered six countries of the CIS, creating a limitation for the empirical results. In terms of state quality variable, the index missed data for some years. Even if the state quality does not have much intra country fluctuation as an index, this represents still a limitation.
In terms of research design, first the wish to consider all Eurasian transition countries with available data led to large heterogeneity among countries. In addition, the research design entailed the use of only four variables. This choice was dictated by the aim of focusing on the state vs market forces and not to identify all the possible determinants of TC. As a result, only control variables that were significant in the regression were considered. In fact, even variables on education and urbanization were tried as control variables but significance was not identified. In addition, because of data availability, this study has used as the dependent variables the consumption of tobacco. However, because TTC introduced lighter brands as compared to the domestic ones, using a variable that accounted for the quantities of harmful substances consumed, like nicotine, tar or CO, would have been a better variable for development.
9.Future Research
Better data quality is a first step for the development of future research both in the EEFSC and in other case studies of transitioning countries. In terms of design, the use of a different methodology, like difference in differences or more complex regression, made possible by better data availability, could be stronger evidence of the results. In particular, the use of consumption of harmful substances could be a better variable used as a proxy for development.
DV410 31699
Further research is required in other contexts of transitioning countries, like Cambodia, China, Laos, Mongolia, and Vietnam and Cuba, and with other harmful substances, like alcohol, to support the results of this case study.
In addition, similarly to Stuckler et al. (2009) approach to mass privatization, it would be useful to study if and how the speed of the transition affects development outcomes. This research would be useful to study if the institutional approach, as compared to the shock therapy, helped the state better develop and softened the impact that harmful investments could have had on health. Moreover, studying this relationship as well for countries not in transition, could be useful to study the behaviour in a normal setting. Lastly, further research is needed to identify how the state can improve its government effectiveness, control of corruption and rule of law to provide practical guidelines.
10.Conclusions
The research had the aim of understanding to what extent the market or the state have influenced TC during the transition in EEFSC. This aim has been accomplished by running a regression analysis with fixed effects, which showed that FDI were not significantly correlated to TC, while the state was. These results lead to the conclusion that it was not the market, through FDI, rather the state, through its ability to have control and effectiveness on its policies, that may have shaped TC. These results are valuable within the state versus market debate, meant with a new development conceptualization, to support the state side of the debate in driving TC and, hence, health and development. These results are helpful to drive policy implications on the importance of the role of the state in determining development and the role of the state during transition. Although further research is needed in different case studies and risk factors to support these results, this research represents a good starting point to create knowledge on how to improve health and development in transitioning countries.
DV410 31699
11.Bibliography
Ahmad, J., Yang, J., 1998. TRADE LIBERALIZATION IN EASTERN EUROPEAN COUNTRIES AND THE PROSPECTS OF THEIR INTEGRATION INTO THE WORLD TRADING SYSTEM 16.
Ahmed, S. (Ed.), 2013. Foreign direct investment, trade and economic growth: challenges and
opportunities. Routledge, New Delhi.
Bevan, A.A., Estrin, S., 2004. The determinants of foreign direct investment into European transition economies. Journal of Comparative Economics 32, 775–787. https://doi.org/10.1016/j.jce.2004.08.006
Bitzenis, A., 2009. The Balkans: Foreign Direct Investment and EU Accession 39.
Bobadilla, J.L., Costello, C.A., Mitchell, F., 1997. Premature Death in the New Independent States. National Academies Press.
Bobak, M., 2006. Changes in smoking prevalence in Russia, 1996-2004. Tobacco Control 15, 131 135. https://doi.org/10.1136/tc.2005.014274
Bobak, M., Marmot, M., 2009. Societal transition and health. The Lancet 373, 360–362. https://doi.org/10.1016/S0140-6736(09)60043-X
Bozicevic, I., Gilmore, A.B., 2003. Tobacco use, a major public health issue in south-east Europe 4.
Brodman, H., 2005. From Disintegration to Reintegration: Eastern Europe and the Former Soviet Union in International Trade.
Chaloupka, F., Laixuthai, A., 1996. U.S Trade Policy and Cigarette Smoking in Asia.
Chang, H.-J., 2009. Hamlet without the Prince of Denmark: How development has disappeared from today’s ‘development’ discourse.
Danishevski, K., Gilmore, A., McKee, M., 2008. Public attitudes towards smoking and tobacco control policy in Russia. Tobacco Control 17, 276–283. https://doi.org/10.1136/tc.2008.025759
Deacon, B., 2000. Eastern European welfare states: the impact of the politics of globalization. Journal of European Social Policy 10, 146–161. https://doi.org/10.1177/a012487
Drahokoupil, J., 2008. Globalization and the State in Central and Eastern Europe, 0 ed. Routledge. https://doi.org/10.4324/9780203892084
Earle, J.S., Gehlbach, S., 2011. Did Post-communist Privatization Increase Mortality? Comparative Economic Studies 22.
Euromonitor International, 2022. Euromonitor International [WWW Document]. Euromonitor. URL https://www.euromonitor.com/ (accessed 7.25.22).
European Commission. Directorate General for Economic and Financial Affairs., 2019. FDI in the Czech Republic: a Visegrád comparison. Publications Office, LU.
European Commission Eurostat, 2013. International trade and foreign direct investment.
Publications Office, LU.
DV410 31699
Ferris, S.P., Thompson, G.R., Valsan, C., 1994. Foreign Direct Investment in an Emerging Market Economy: The Case of Romania. Eastern European Economics 32, 81–95. https://doi.org/10.1080/00128775.1994.11648538
Gavrilova, N.S., Semyonova, V.G., Evdokushkina, G.N., 2002. Mortality Crisis in Russia: New Health Threats 33.
Georgieva, L., Powles, J., Genchev, G., Salchev, P., Poptodorov, G., 2002. Bulgarian Population in Transitional Period. Croat Med J 5.
Gerry, C.J., Mickiewicz, T.M., Nikoloski, Z., 2010. Did mass privatisation really increase post communist mortality? 1.
Gilmore, A., McKee, M., 2005. How the east was won: BAT and big tobacco’s conquest of the former Soviet Union. How the east was won 10.
Gilmore, A.B., 2005. Exploring the impact of foreign direct investment on tobacco consumption in the former Soviet Union. Tobacco Control 14, 13–21. https://doi.org/10.1136/tc.2003.005082
Gilmore, A.B., 2004a. Moving East: how the transnational tobacco industry gained entry to the emerging markets of the former Soviet Union–part I: establishing cigarette imports. Tobacco Control 13, 143–150. https://doi.org/10.1136/tc.2003.005108
Gilmore, A.B., 2004b. Tobacco and transition: an overview of industry investments, impact and influence in the former Soviet Union. Tobacco Control 13, 136–142. https://doi.org/10.1136/tc.2002.002667
Gilmore, A.B., 2004c. Tobacco and transition: an overview of industry investments, impact and influence in the former Soviet Union. Tobacco Control 13, 136–142. https://doi.org/10.1136/tc.2002.002667
Gilmore, A.B., Fooks, G., McKee, M., 2011. A review of the impacts of tobacco industry privatisation: Implications for policy. Global Public Health 6, 621–642. https://doi.org/10.1080/17441692.2011.595727
Gilmore, A.B., McKee, M., Rose, R., 2001. Prevalence and determinants of smoking in Belarus: A national household survey, 2000 9.
Gilmore, A.B., Radu-Loghin, C., Zatushevski, I., McKee, M., 2005. Pushing up smoking incidence: plans for a privatised tobacco industry in Moldova. The Lancet 365, 1354–1359. https://doi.org/10.1016/S0140-6736(05)61035-5
Grogan, L., 2006. Alcoholism, Tobacco, and Drug Use in the Countries of Central and Eastern Europe and the Former Soviet Union. Substance Use & Misuse 41, 567–571. https://doi.org/10.1080/10826080500521664
DV410 31699
Gurkov, I., 2015. Transition Economy, in: Cooper, C.L. (Ed.), Wiley Encyclopedia of Management. John Wiley & Sons, Ltd, Chichester, UK, pp. 1–3. https://doi.org/10.1002/9781118785317.weom060204
Hayes, A., Ciobanu, M., 2013. Tobacco Control in Practice Article 11: Packaging and labelling of tobacco products 16.
Hoffman, S.J., Mammone, J., Rogers Van Katwyk, S., Sritharan, L., Tran, M., Al-Khateeb, S., Grjibovski, A., Gunn, E., Kamali-Anaraki, S., Li, B., Mahendren, M., Mansoor, Y., Natt, N., Nwokoro, E., Randhawa, H., Yunju Song, M., Vercammen, K., Wang, C., Woo, J., Poirier, M.J., 2019. Cigarette consumption estimates for 71 countries from 1970 to 2015: systematic collection of comparable data to facilitate quasi-experimental evaluations of national and global tobacco control interventions. BMJ l2231. https://doi.org/10.1136/bmj.l2231
Hurt, R.D., 1995. Smoking in Russia: What Do Stalin and Western Tobacco Companies Have in Common? Mayo Clinic Proceedings 70, 1007–1011. https://doi.org/10.4065/70.10.1007
Jassem, J., Przewo, K., Zatoński, W., 2014. Tobacco control in Poland—successes and challenges. Translational lung cancer research 3, 6.
Joossens, L., Raw, M., 2007. Progress in Tobacco Control in 30 European Countries, 2005 to 2007 24.
Kholmogorova, G., Prokhorov, A., 1994. West goes East: the new tobacco situation in Russia.
King, L., Stuckler, D., 2007. Mass Privatization and the Post-communist Mortality Crisis, in: Lane, D. (Ed.), The Transformation of State Socialism. Palgrave Macmillan UK, London, pp. 197–218. https://doi.org/10.1057/9780230591028_11
King, L.P., Sznajder, A., 2006. The State‐Led Transition to Liberal Capitalism: Neoliberal, Organizational, World‐Systems, and Social Structural Explanations of Poland’s Economic Success. American Journal of Sociology 112, 751–801. https://doi.org/10.1086/507851
Kislitsyna, O., Stickley, A., Gilmore, A., McKee, M., 2010. The social determinants of adolescent smoking in Russia in 2004. Int J Public Health 55, 619–626. https://doi.org/10.1007/s00038 010-0196-6
Leon, D.A., Saburova, L., Tomkins, S., Andreev, E., Kiryanov, N., McKee, M., Shkolnikov, V.M., 2007. Hazardous alcohol drinking and premature mortality in Russia: a population based case-control study. The Lancet 369, 2001–2009. https://doi.org/10.1016/S0140 6736(07)60941-6
Lewandowski, J.P., 1997. RISK AND FOREIGN DIRECT INVESTMENT IN EMERGING ECONOMIES: LESSONS FROM THE FORMER SOVIET UNION. Risk and Foreign Direct Investment 8.
DV410 31699
Macura, M., Mac Donald, A.L., Haug, W., United Nations, United Nations Population Fund (Eds.), 2005. The new demographic regime: population challenges and policy responses. Geneva : United Nations, New York.
McGrady, B., 2007. Trade liberalisation and tobacco control: moving from a policy of exclusion towards a more comprehensive policy. Tobacco Control 16, 280–283. https://doi.org/10.1136/tc.2006.019141
Mendez Lopez, A., Loopstra, R., McKee, M., Stuckler, D., 2017. Is trade liberalisation a vector for the spread of sugar-sweetened beverages? A cross-national longitudinal analysis of 44 low- and middle-income countries. Social Science & Medicine 172, 21–27. https://doi.org/10.1016/j.socscimed.2016.11.001
Meslé, F., 2004. Mortality in Central and Eastern Europe: Long-term trends and recent upturns. DemRes Special 2, 45–70. https://doi.org/10.4054/DemRes.2004.S2.3
Metcalf, L.K., 1997. The (Re)Emergence of Regional Economic Integration In the Former Soviet Union 21.
Meyer, K.E., Pind, C., 1998. Ten Years of Direct Foreign Investment in the Former Soviet Union: A Survey with Special Focus on Kazakhstan. SSRN Journal. https://doi.org/10.2139/ssrn.136588
OECD, 2019. STRENGTHENING THE RULE OF LAW: MAKING THE CASE.
Orenstein, M.A., Haas, M.R., 2002. Globalization and the Development of Welfare States in Postcommunist Europe 26.
Perlman, F., Bobak, M., Gilmore, A., McKee, M., 2007. Trends in the prevalence of smoking in Russia during the transition to a market economy. Tobacco Control 16, 299–305. https://doi.org/10.1136/tc.2006.019455
Pomerleau, J., Gilmore, A., McKee, M., Rose, R., Haerpfer, C.W., 2004. Determinants of smoking in eight countries of the former Soviet Union: results from the Living Conditions, Lifestyles and Health Study. Addiction 99, 1577–1585. https://doi.org/10.1111/j.1360 0443.2004.00885.x
Rechel, B., Roberts, B., Richardson, E., Shishkin, S., Shkolnikov, V.M., Leon, D.A., Bobak, M., Karanikolos, M., McKee, M., 2013. Health and health systems in the Commonwealth of Independent States. The Lancet 381, 1145–1155. https://doi.org/10.1016/S0140 6736(12)62084-4
Rezaei, S., Sari, A.A., Arab, M., Majdzadeh, R., Poorasl, A.M., 2016. Economic burden of smoking: a systematic review of direct and indirect costs. Med J Islam Repub Iran 30, 8.
DV410 31699
Roberts, B., Gilmore, A., Stickley, A., Kizilova, K., Prohoda, V., Rotman, D., Haerpfer, C., Martin, M., 2013. Prevalence and Psychosocial Determinants of Nicotine Dependence in Nine Countries of the Former Soviet Union.
Ross, H., 2004. Russia (Moscow) 1999 Global Youth Tobacco Survey.
Sen, A., 2001. Development as freedom. Oxford University Press, Oxford.
Shkolnikov, V., McKee, M., Leon, D.A., 2001. Changes in life expectancy in Russia in the mid 1990s. The Lancet 357, 917–921. https://doi.org/10.1016/S0140-6736(00)04212-4
Shkolnikov, V.M., Cornia, G.A., Leon, D.A., Meslé, F., 1998. Causes of the Russian mortality crisis: Evidence and interpretations. World Development 26, 1995–2011. https://doi.org/10.1016/S0305-750X(98)00102-8
Shleifer, A., 1997. Government in transition.
Skafida, V., Silver, K.E., Rechel, B.P.D., Gilmore, A.B., 2014. Change in tobacco excise policy in Bulgaria: the role of tobacco industry lobbying and smuggling. Tob Control 23, e75–e84. https://doi.org/10.1136/tobaccocontrol-2012-050600
Stuckler, D., King, L., McKee, M., 2009. Mass privatisation and the post-communist mortality crisis: a cross-national analysis. The Lancet 373, 399–407. https://doi.org/10.1016/S0140 6736(09)60005-2
Svetličič, M., Rojec, M., 1998. Short Overview of the Slovenian Economy and Foreign Investment in Slovenia. Eastern European Economics 36, 60–72. https://doi.org/10.1080/00128775.1998.11648675
Szilagyi, T., 2003. Hungry for Hungary: examples of tobacco industry’s expansionism 23.
Szilagyi, T., 2002. Hungary introduces a total ban on tobacco advertising. Tobacco Control 11, 79 81. https://doi.org/10.1136/tc.11.1.79
Tondel, L., 2001. Foreign direct investment during transition: determinants and patterns in Central and Eastern Europe and the former Soviet Union. Chr. Michelsen Institute, Bergen.
UN, 2018. The 2030 Agenda and the Sustainable Development Goals: An opportunity for Latin America and the Caribbean [WWW Document]. URL https://sdgs.un.org/ (accessed 8.3.22).
UNDP (Ed.), 1999. Globalization with a human face, Human development report / publ. for the United Nations Development Programme (UNDP). Oxford Univ. Press, New York.
WHO, 2021. Tobacco [WWW Document]. WHO.int. URL https://www.who.int/news-room/fact sheets/detail/tobacco (accessed 3.30.22).
World Bank, 2022. Worldwide Governance Indicators | DataBank [WWW Document]. URL
https://databank.worldbank.org/source/worldwide-governance-indicators (accessed 7.25.22).

