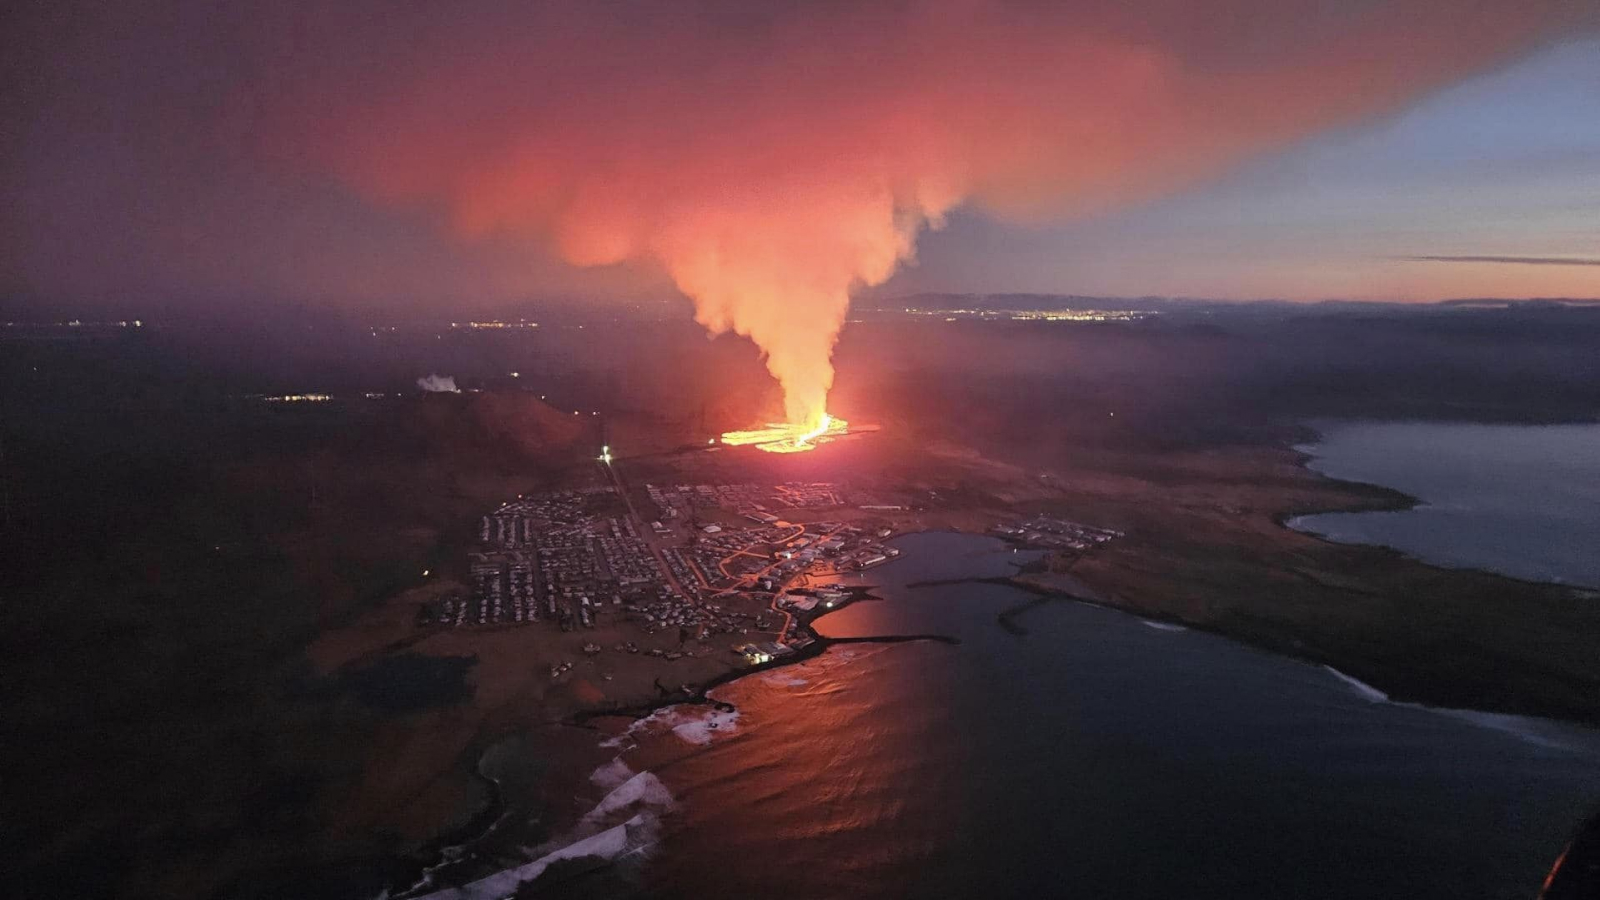
On Oct. 29, 2012, Superstorm Sandy unleashed a 14-foot (4 meters) wall of seawater into New York City. Regionally, the storm killed 147 people, inflicted $50 billion in damage, and opened a window into the future.
By mid-century, flooding like this could become routine.
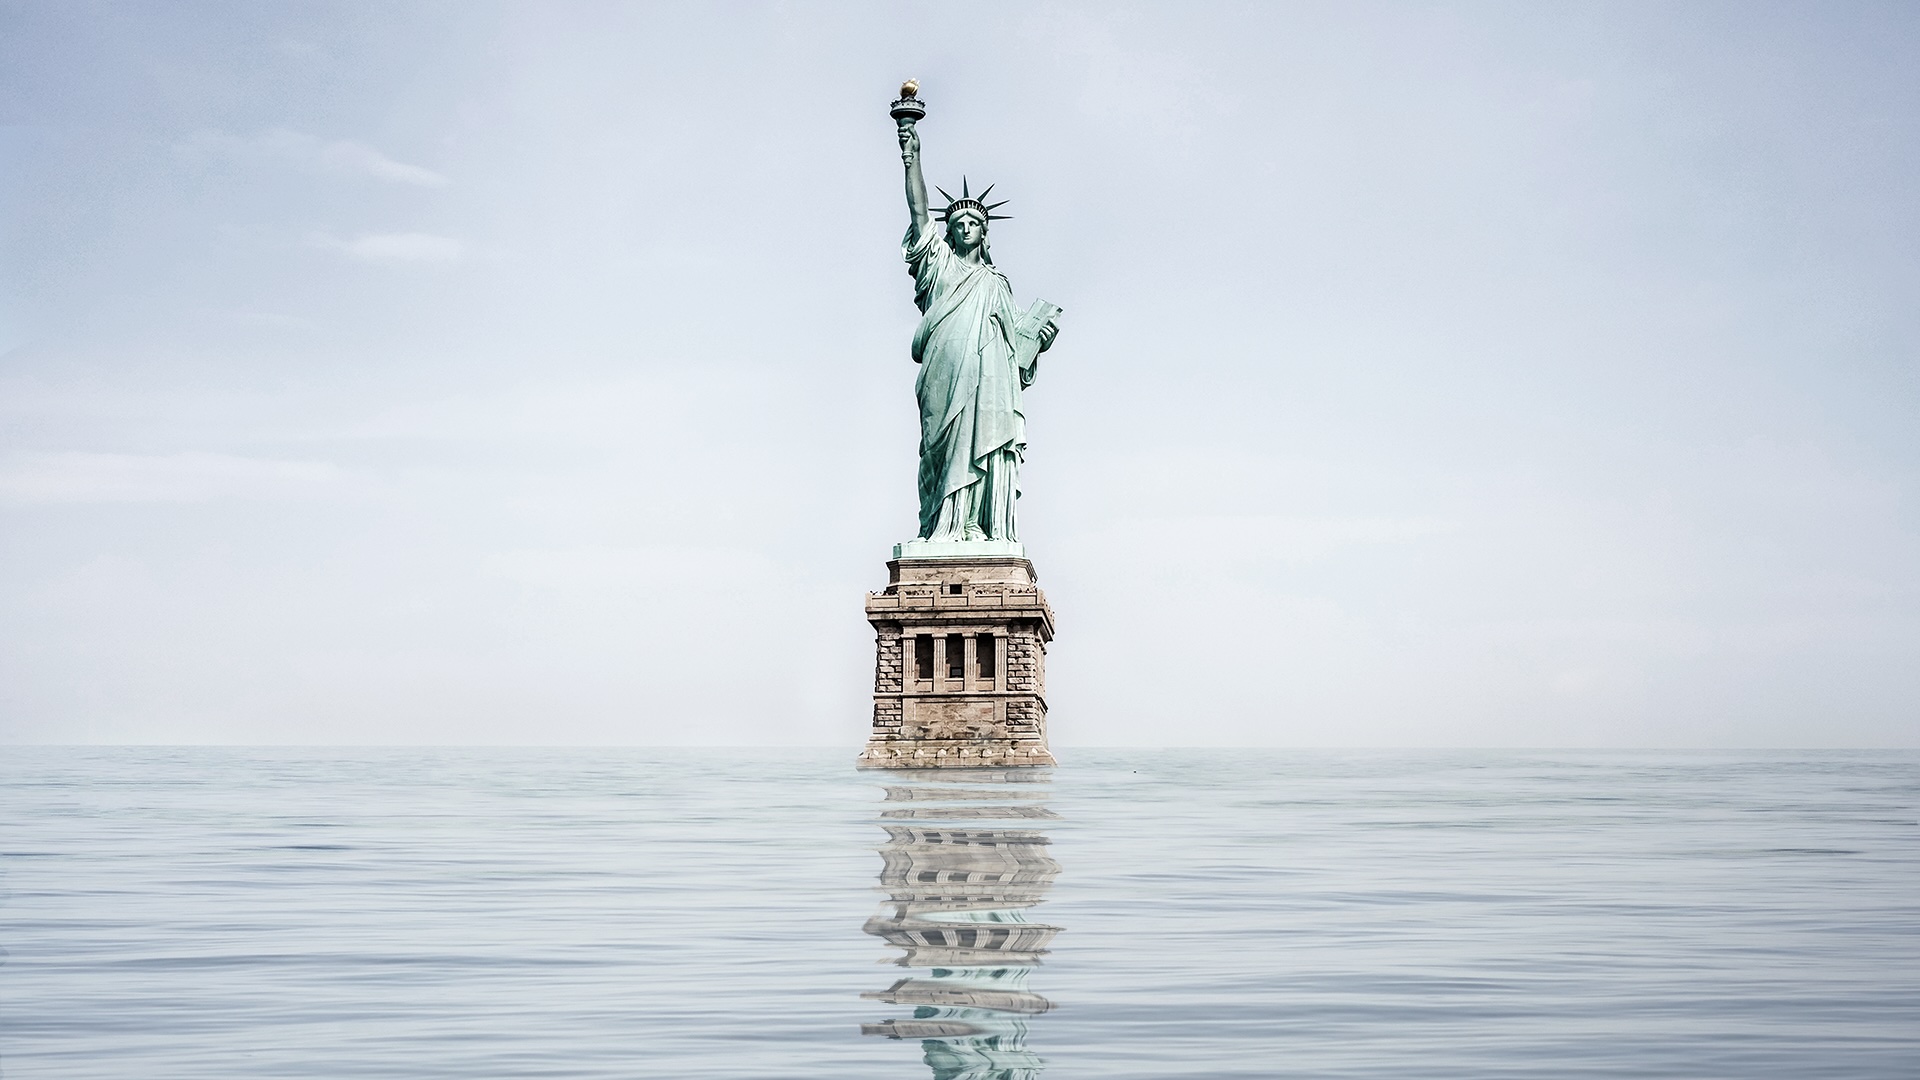
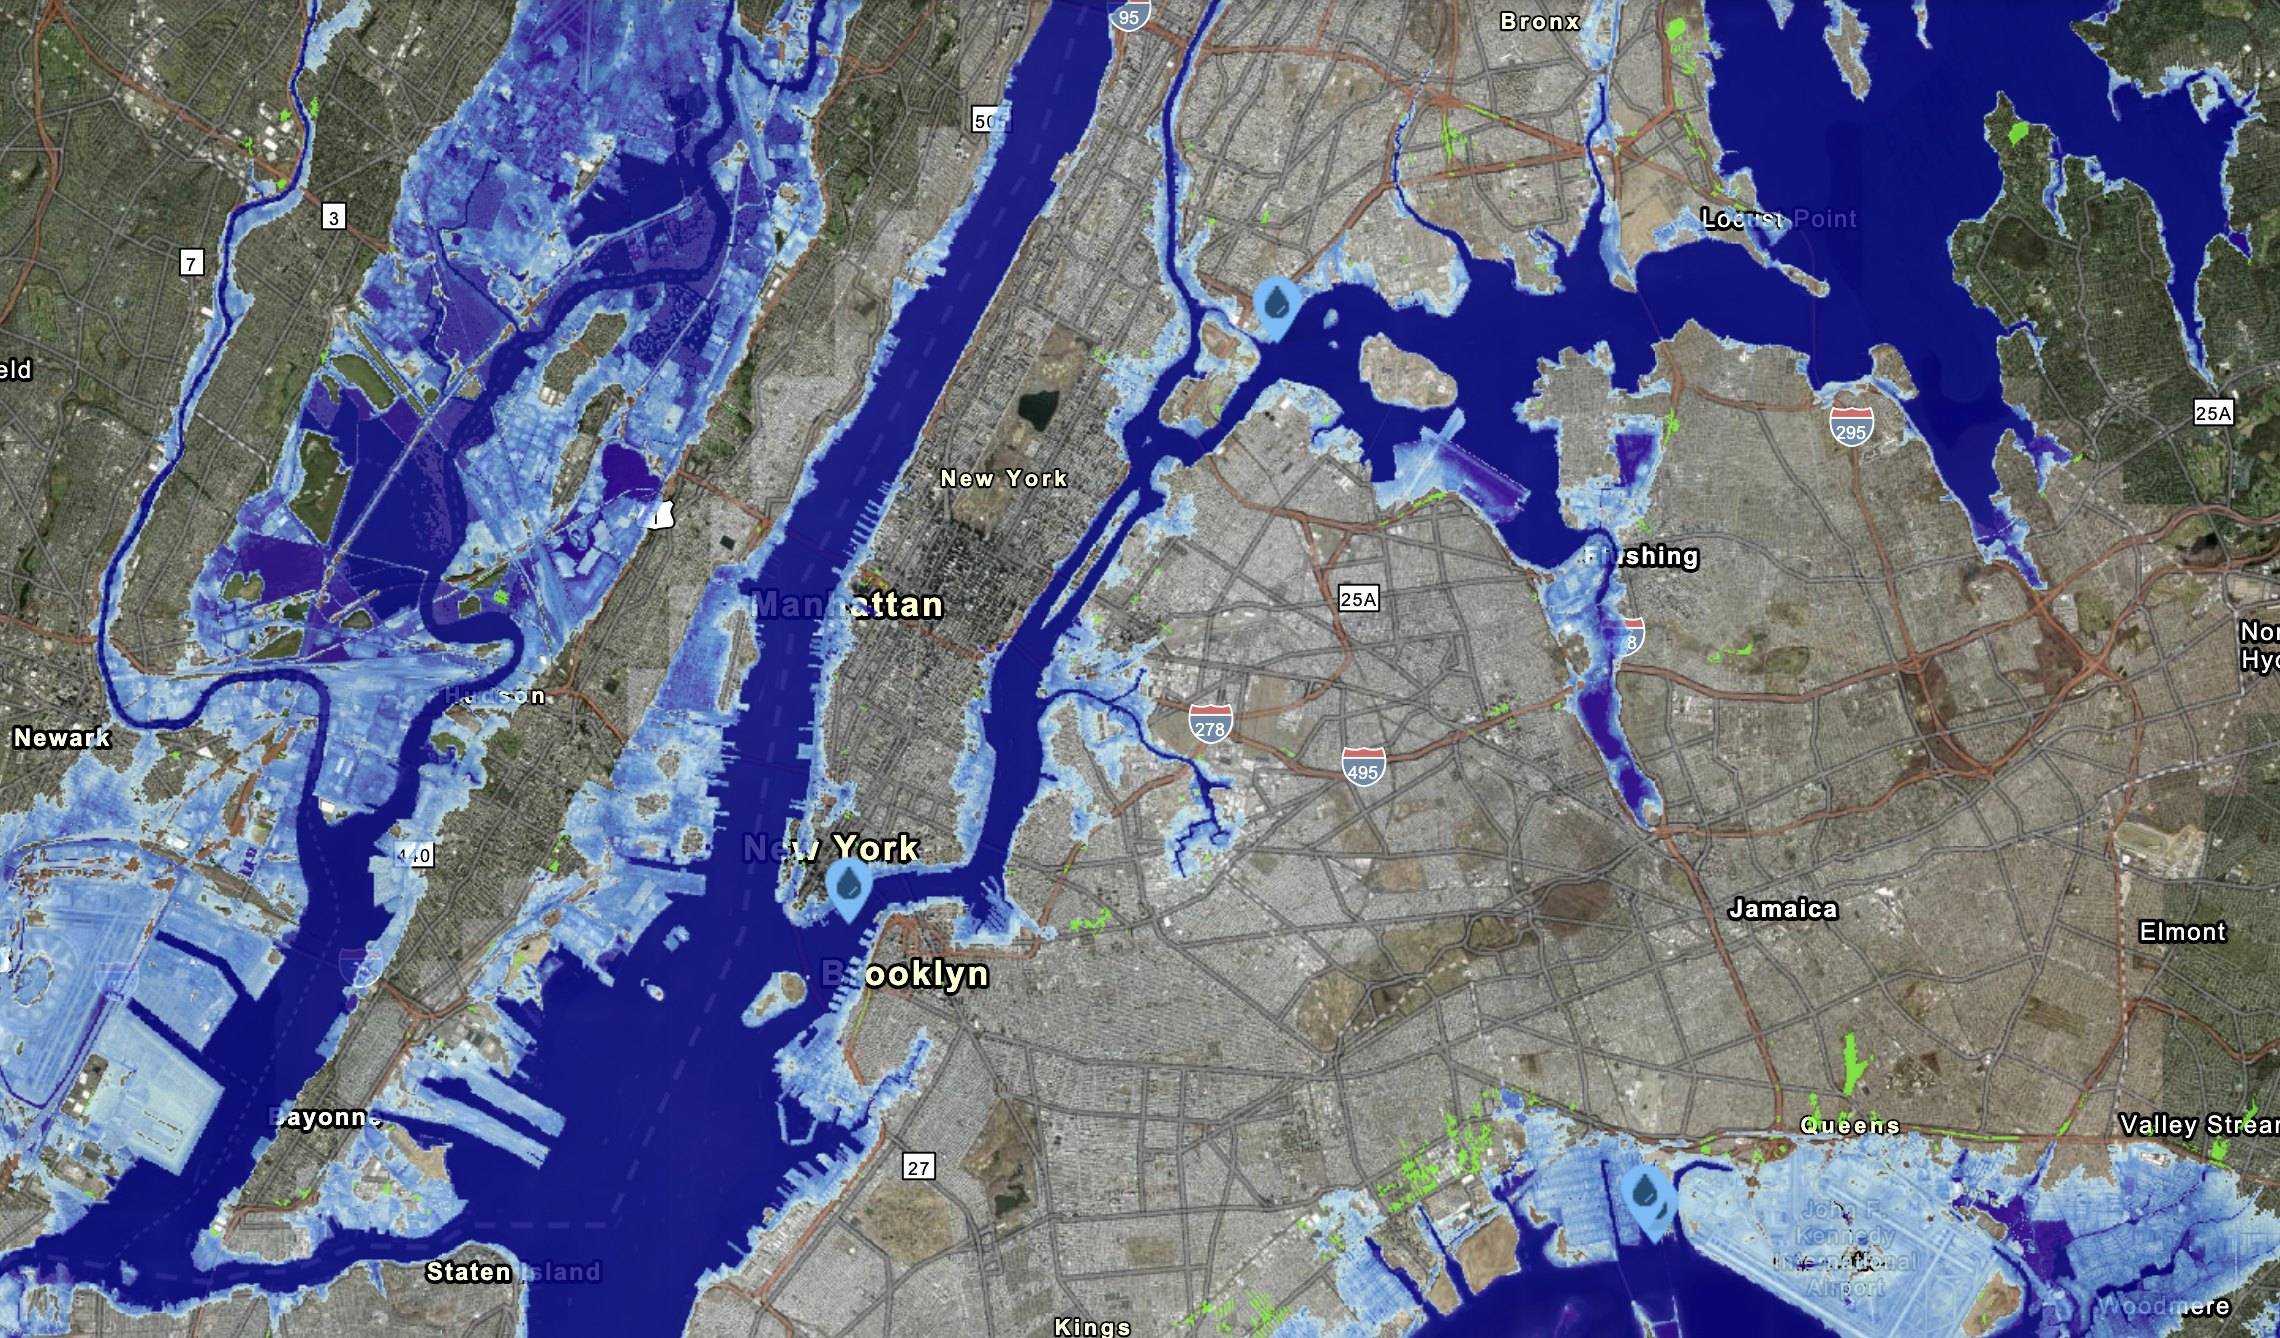
While the Statue of Liberty may not be submerged, low-lying places like Ellis Island could be underwater. By 2100, sea-level rise alone could approach Sandy’s 2012 high water mark. The NYC Panel on Climate Change (NPCC) predicts up to 2.5 feet (0.76 m) of local sea-level rise by the 2050s and 9.5 feet (3 m) by 2100.
However, new evidence from Earth’s past suggests these dire scenarios may be likely — and perhaps even conservative predictions.
Around 2.6 million years ago, the planet descended into the Quaternary, a period of alternating glacial-interglacial cycles that occurred roughly every 100,000 years. These cycles, driven partly by the planet’s eccentric wobbles, tweak the amount of solar radiation reaching Earth. During cold (glacial) cycles, ice sheets sprawled across Antarctica, Greenland and North America, locking away water and lowering sea levels. In warmer (interglacial) times, the ice retreated and oceans rose.
The key to understanding today’s rising seas may lie in the Last Interglacial (129,000 to 116,000 years ago), when global temperatures peaked at 1.8 to 3.6 degrees Fahrenheit (1 to 2 degrees Celsius) above preindustrial levels. Considering we’re currently 2.7 F (1.5 C) above preindustrial levels, the Last Interglacial could presage changes in the coming decades as human-caused warming continues.
For years, researchers believed North America’s Laurentide Ice Sheet disappeared very early in the Last Interglacial. But new evidence suggests the Laurentide lingered thousands of years after that. If true, this fundamentally alters our understanding of where and how quickly ice melted back then.
New models suggest that if the Laurentide persisted, Antarctica likely melted more — and more rapidly — than previously thought. And that has worrying implications for future sea levels.
“We all want to understand how small Antarctica’s ice sheet became the last time Earth reached similar temperatures,” Roger Creel, a geophysicist at Woods Hole Oceanographic Institution in Massachusetts who studies sea-level change, told Live Science. “Sea-level projections may be too low if Antarctic melt was underestimated.”
Sea-level-rise projections
Global seas have risen a little less than 1 foot (0.25 m) since 1880. With the rate doubling since 2006, another quarter meter is all but certain by 2100. But that’s likely an underestimate, as scientists expect accelerating polar melt.
The problem is pinning down how much the poles will melt.
Projecting sea levels is similar to forecasting a storm’s path: We are trying to predict the future from past data. Unlike with a modern storm, however, very few of our sea-level records are definitive.
Direct measurements — taken from tide gauges and satellite data — capture just a blink of geologic time. The Liverpool tide gauge, one of the longest-running records, spans just 300 years, or 0.01% of the Quaternary. Predicting the future based only on direct measurements, then, is a bit like guessing a novel’s ending from just the first few chapters.
Further back in time, the record gets murkier. Ancient glaciers obliterated much of the physical evidence that could help explain past climate changes. Where direct evidence survives — say, in ice cores or rubble piles — dating can be challenging. What’s left is a patchwork of clues — fossils, sediments and ancient shorelines — that scientists piece together like detectives.
Patchwork of evidence
One person deciphering these ancient clues is Andrea Dutton, a University of Wisconsin-Madison geologist.
Far from Antarctica, jagged limestone scarps rise from the turquoise waters of the Caribbean. Beginning about 129,000 years ago, ice melted, seas swelled, and reefs grew to chase the sun. These reefs preserve evidence of sea-level fluctuations like mosquitoes in amber. Receding waters marooned these fossilized reefs on land, leaving them for researchers like Dutton to study.
Dutton has spent years tracking coral growth-and-death cycles to untangle how seas rose and fell during the Last Interglacial. Researchers still debate how high or fast seas rose, with estimates ranging from 6.5 to 33 feet (2 to 10 m) above present levels.
Dutton’s work has taken her across the globe, and what she’s found is perplexing. In the Caribbean, for example, sea levels peaked multiple times, whereas Chilean shores show no such patterns.
The public generally imagines uniform sea-level rise — a meter in Vancouver, a meter in Sydney. But that uniform rise “is a figment of our imagination,” Dutton told Live Science.
In fact, deciphering ancient sea levels is maddeningly complex. That’s partly because land surfaces aren’t static, either. For instance, Dutton recalled researchers cataloging fossil corals in Papua New Guinea, only to find their study site uplifted by a sudden earthquake, which jumbled the geological record of historic sea levels. Aside from shifting coastlines, gravitational forces can distribute water unequally across the planet.
“That’s why it’s so important to look at many sites,” Dutton said. “They all have different stories, yet clearly one thing must have happened in terms of global sea level.”
Researchers initially attributed mysterious sea-level shifts — multiple peaks in some regions and falls in others — mainly to the melting and regrowing of Greenland and Antarctica during the Last Interglacial. But the idea of ice sheets regrowing when temperatures remained high never sat right with some. When evidence emerged from deep in the North Atlantic showing the Laurentide persisted, researchers needed a new model.
The lingering Laurentide
Creel set out to explain these mysterious sea-level patterns as part of his doctoral dissertation work under Jacqueline Austermann at Columbia’s Lamont-Doherty Earth Observatory. Perched on rock once polished by the Laurentide Ice Sheet, the campus overlooks the Hudson River from a safe elevation above encroaching seas.
The Laurentide remains central to the big question: How high and fast will seas rise again?
Creel frames it like an accountant. Scientists typically budget interglacial sea levels from known suspects: ocean thermal expansion, Greenland, Antarctica and mountain glaciers. But the Laurentide adds a new line to the ledger.
For Creel and Austermann, timing is everything. “Antarctica is probably more vulnerable than we thought,” Creel said. “If the Laurentide lasted longer, it may have masked how much Antarctica melted.”
Once sprawling across 5 million square miles (13 million square kilometers) with ice up to 10,000 feet (3,000 m) thick, the Laurentide carved the Hudson River Valley and Great Lakes, growing and shrinking through ice ages. Today, evidence of it lingers in overgrown rubble piles and other topographic oddities. “The Laurentide is gone but not forgotten,” Creel said.
For years, some scientists suspected a long-lived Laurentide, but hard evidence was scarce. That changed in 2022, when researchers studying North Atlantic sediment cores found signs of an enormous ice dam collapse 125,000 years ago — implying large amounts of North American ice.
A month later, a lead isotope study revealed the Laurentide lasted until around 122,000 years ago — well after temperatures rose during the Last Interglacial. And a 2023 study suggested this pattern wasn’t unusual; sediments dropped from icebergs indicated the Laurentide melted only briefly and infrequently across multiple Quaternary interglacials.
To balance the books, Creel and Austermann fit together scattered and seemingly contradictory pieces of evidence — ice cores, fossils, sediments and geophysical properties — into a cohesive narrative.
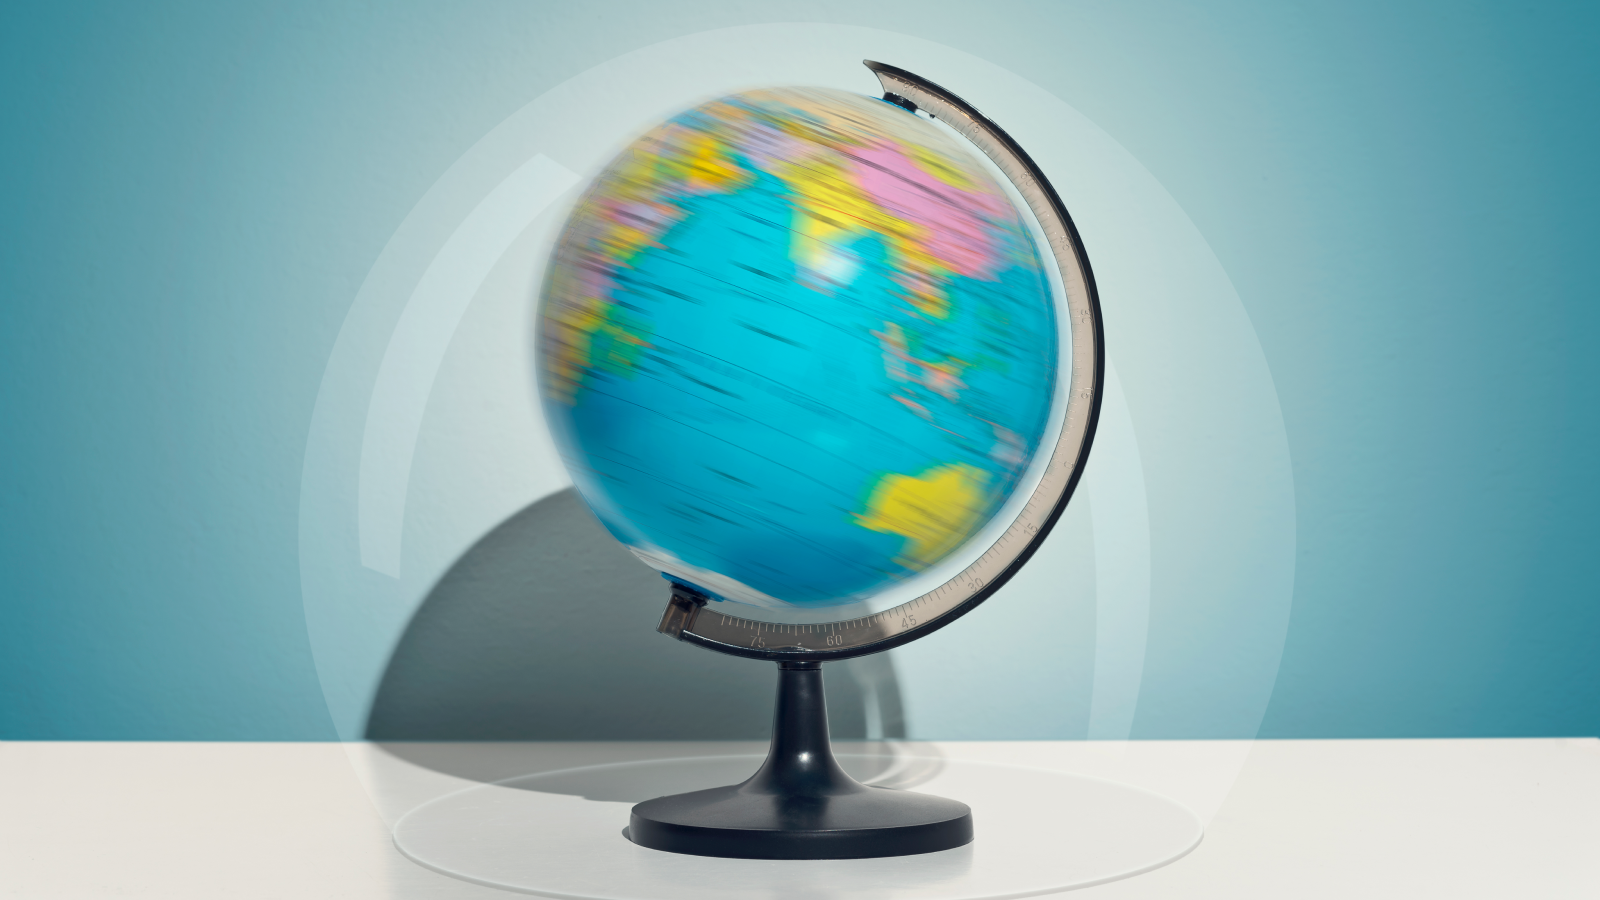
A key element, they found in a study published late last year, was a process called isostatic adjustment. Ice sheets press down on the land; when they melt, the ground rebounds, altering Earth’s rotation and gravity.
“It’s like sitting on a cheap mattress,” said Natasha Barlow, a paleoceanographer at the University of Leeds in the U.K. who was not involved in the study. “It sinks under your weight, and the other end rises — just like how ice compresses the Earth. When it melts, the ‘mattress’ rebounds, affecting sea levels differently depending on where you are.”
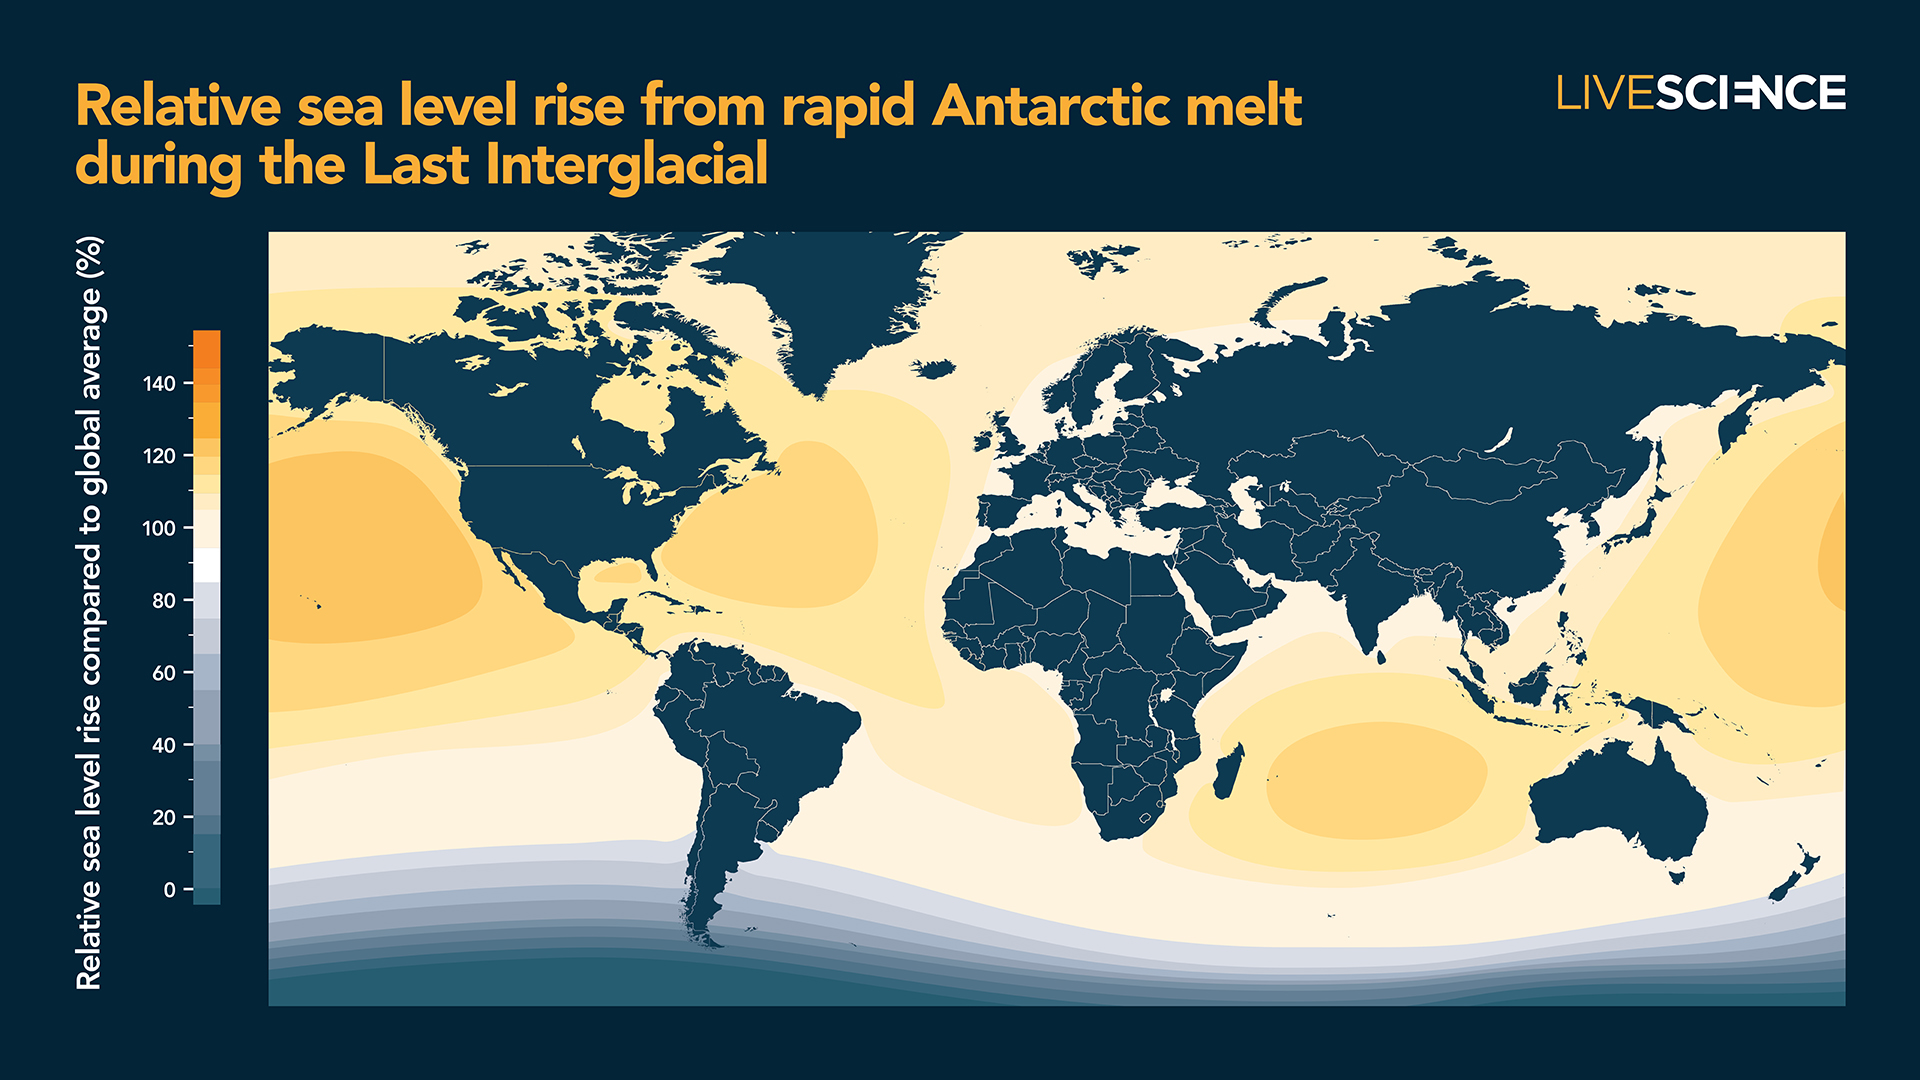
Researchers already knew this process occurred, but the revised model’s implications are striking: Antarctica experienced “rapid and drastic” ice loss early in the Last Interglacial — outpacing Greenland’s melt — which caused the Antarctic crust to rise, sloshing water north. That raised sea levels in the Caribbean and other regions but caused them to fall near Antarctica. The process continued, lifting and dropping local seas differently in the global North versus the South.
“It was like a competition between the poles,” Dutton said.
The model connected many puzzling data points, including the persistent Laurentide Ice Sheet and the confusing sea-level patterns of the Last Interglacial, Barlow said.
These findings help explain ancient sea-level puzzles, but they also hint at what’s coming. If Antarctica melts faster than expected, places like New York will bear the brunt. While global seas may rise 6 feet (2 m) by 2100, New York could see a 10-foot (3 m) rise.
“For many years, we’ve said it’s all about Greenland and Antarctica,” Barlow told Live Science. “But the evidence over the last five years says, ‘Hold on a second. Maybe the Laurentide persisted longer than we thought.’ This is the first study seriously considering its influence at this level. If we’re going to calibrate our models for the future, we need to think about this.”
All eyes on West Antarctica
Because most of Antarctica’s ice lurks below sea level, it is more vulnerable to melt than Greenland’s land-based ice — precariously so in West Antarctica.
In 1978, glaciologist John Mercer warned that rising carbon dioxide levels could trigger the collapse of the West Antarctic Ice Sheet, causing 15 feet (5 m) of sea-level rise and the “submergence of low-lying areas.” His claims, which initially drew accusations of alarmism, now appear eerily prescient.
Whether seas rise slowly or exponentially depends on carbon dioxide emissions and ice sheet behavior.
In the past decade, researchers have coalesced around the idea that marine ice sheet instability (MISI) may lead to considerable West Antarctic melt. In MISI, warm water melts ice along Antarctica’s coast, causing the grounding line — the ice’s contact with the seafloor — to retreat. As the grounding line retreats inland, ice flows faster and more icebergs break into the ocean, accelerating ice loss in a self-reinforcing cycle. MISI, other ice retreat processes, and high-emission scenarios underpin the Intergovernmental Panel on Climate Change’s (IPCC) worst-case predictions.
Mathieu Morlighem, a Dartmouth glaciologist who studies ice sheet physics, believes MISI may be inevitable.
“In all our simulations, West Antarctica collapses,” Morlighem told Live Science, referring to model projections over the next few centuries. West Antarctica alone could contribute over 10 feet to global sea levels.
Evidence from the Last Interglacial also supports the modern observations that West Antarctica is especially prone to melt. Sediment and ice core studies published in 2021 and 2023 suggest West Antarctic ice melted or thinned significantly during the last warm period. Another 2023 study found octopus populations around West Antarctica interbred during the Last Interglacial, which would have been unlikely with an intact ice sheet.
Combined with data about the Laurentide, the emerging picture suggests West Antarctica melted significantly in the Last Interglacial and may do so again over the next several decades.
From the past comes the future
If recent findings hold up and significant West Antarctic melt is imminent, even our gloomiest predictions may be optimistic.
In the IPCC’s “high impact, low probability” 2100 scenario, sprawling and vibrant low-lying areas — including the Jersey Shore; Manhattan’s East Village and Financial District; the Rockaways; Coney Island; Red Hook, Brooklyn; and parts of Staten Island — would be perpetually submerged.
Boost sea level, and you’re looking at the potential for much greater flooding risk.
Daniel Bader, Lamont-Doherty Earth Observatory
New York already experiences “sunny day flooding,” but storm surges would magnify the damage. The NPCC concluded that, by the 2080s, rising sea levels alone — without any changes in storm frequency or intensity — could make today’s “once-in-a-century” coastal floods happen twice as often, or even 10 to 15 times more frequently.
“I can’t dunk. But if I raise the court a foot, my chances are better. Boost sea level, and you’re looking at the potential for much greater flooding risk,” Daniel Bader, a climate scientist at Lamont-Doherty and an NPCC member, told Live Science.
And the new insights from the Last Interglacial could lend weight to this scenario, which was once dismissed as extreme.
Still, several experts cautioned against drawing too many lessons from the past. Ancient clues are scattered, dates are imprecise, and the drivers of warming were vastly different then. Yet some experts told Live Science they believe the IPCC’s worst-case models are, if anything, too conservative.
Unlike warm periods driven by natural processes, today’s warming feels more dire, Dutton said. “Today we’re forcing both [natural and human-induced warming] simultaneously,” she explained. “Greenhouse gas concentrations are heating both poles at the same time.” Warming during the Last Interglacial, by contrast, was likely focused more on the Northern Hemisphere.
For Klaus Jacob, a Columbia University geophysicist and climate mitigation expert, whether the worst-case scenarios are likely is beside the point. The possibility demands action: “Would you board a plane with a 10% likelihood of crashing?” Jacob said.
Jacob envisioned three possible responses: protection, with barriers like those that defend the Netherlands but failed catastrophically in New Orleans during Hurricane Katrina; adaptation, such as using stilts, abandoning ground floors, and embracing Venetian-style boat transport; and relocation.
New York only began earnest reflections after Superstorm Sandy but remains mired in bureaucratic inertia, Jacob said. Coastal defenses are stopgaps, he argued; the real solution is managed retreat. In other words: “Get the hell out.”
That means moving to higher elevations, and potentially abandoning entire low-lying regions along the U.S. East Coast, Gulf Coast and swaths of Asia. And if the retreat isn’t managed?
“It’s chaos,” Jacob told Live Science. “Chaotic retreat.”
This story is part of The 89 Percent Project, an initiative of the global journalism collaboration Covering Climate Now.


